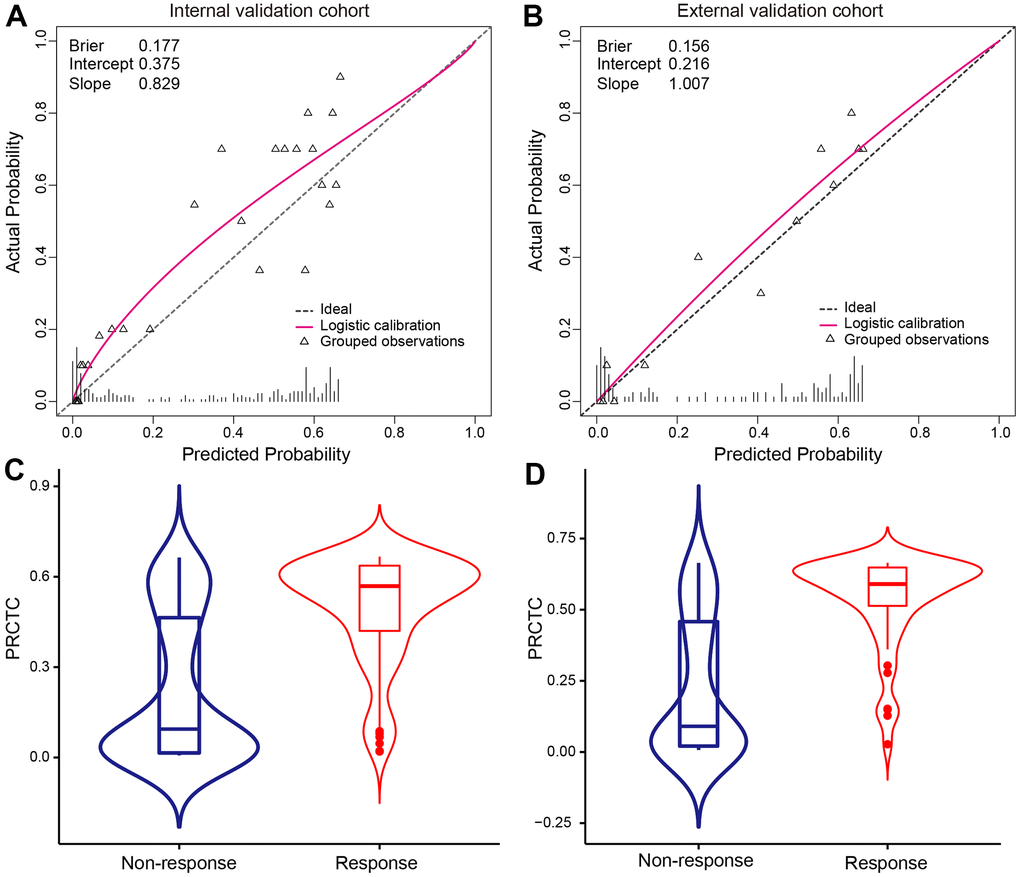
Figure 3.Calibration curves of PRCTC model were shown in validation cohorts. Calibration curves of PRCTC model were shown for internal validation cohort (A) and external validation cohort (B), respectively. The triangle represents the observation group. Each group contained an average of 20 observations. The dashed line is the datum line. The bottom vertical lines refer to the predicted probability distribution. The red curve is the fitted nonparametric calibration curve. PRCTC predicted probability distribution on ground-truth no-response and response patients were shown in internal validation (C) and external validation cohort (D), respectively. Abbreviations: PRCTC, prediction of response to corticosteroid therapy in COVID-19 patients.