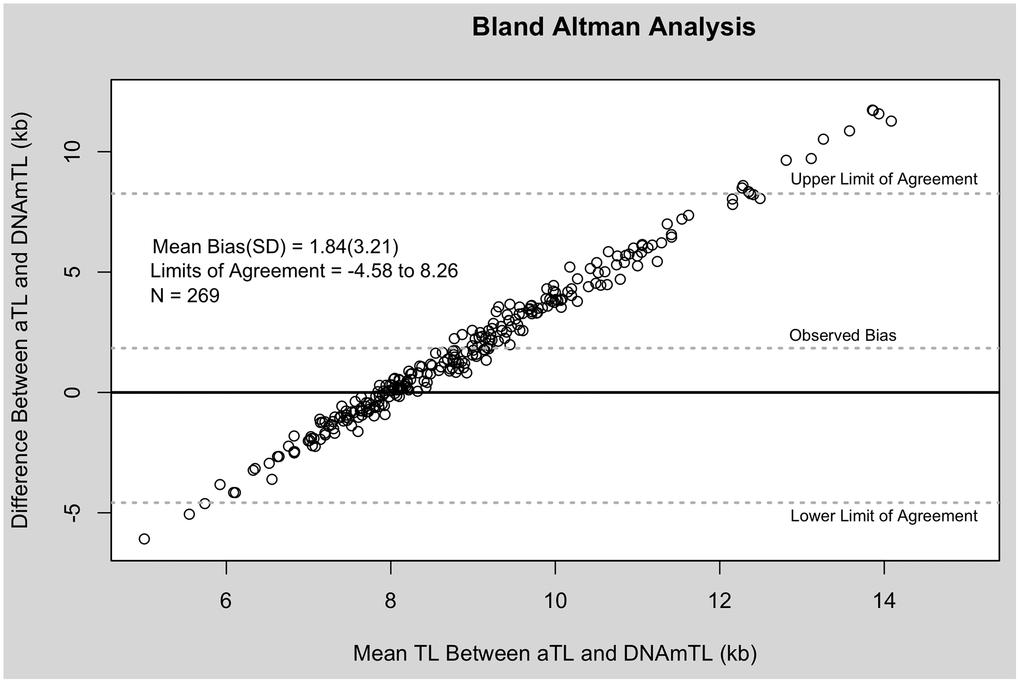
Figure 1.Bland Altman analysis of aTL and DNAmTL. X-axis represents the average of the two measures. The Y-axis represents the difference between the two measures. Each point corresponds to one paired comparison.
Figure 1 — Comparing qPCR and DNA methylation-based measurements of telomere length in a high-risk pediatric cohort | Aging