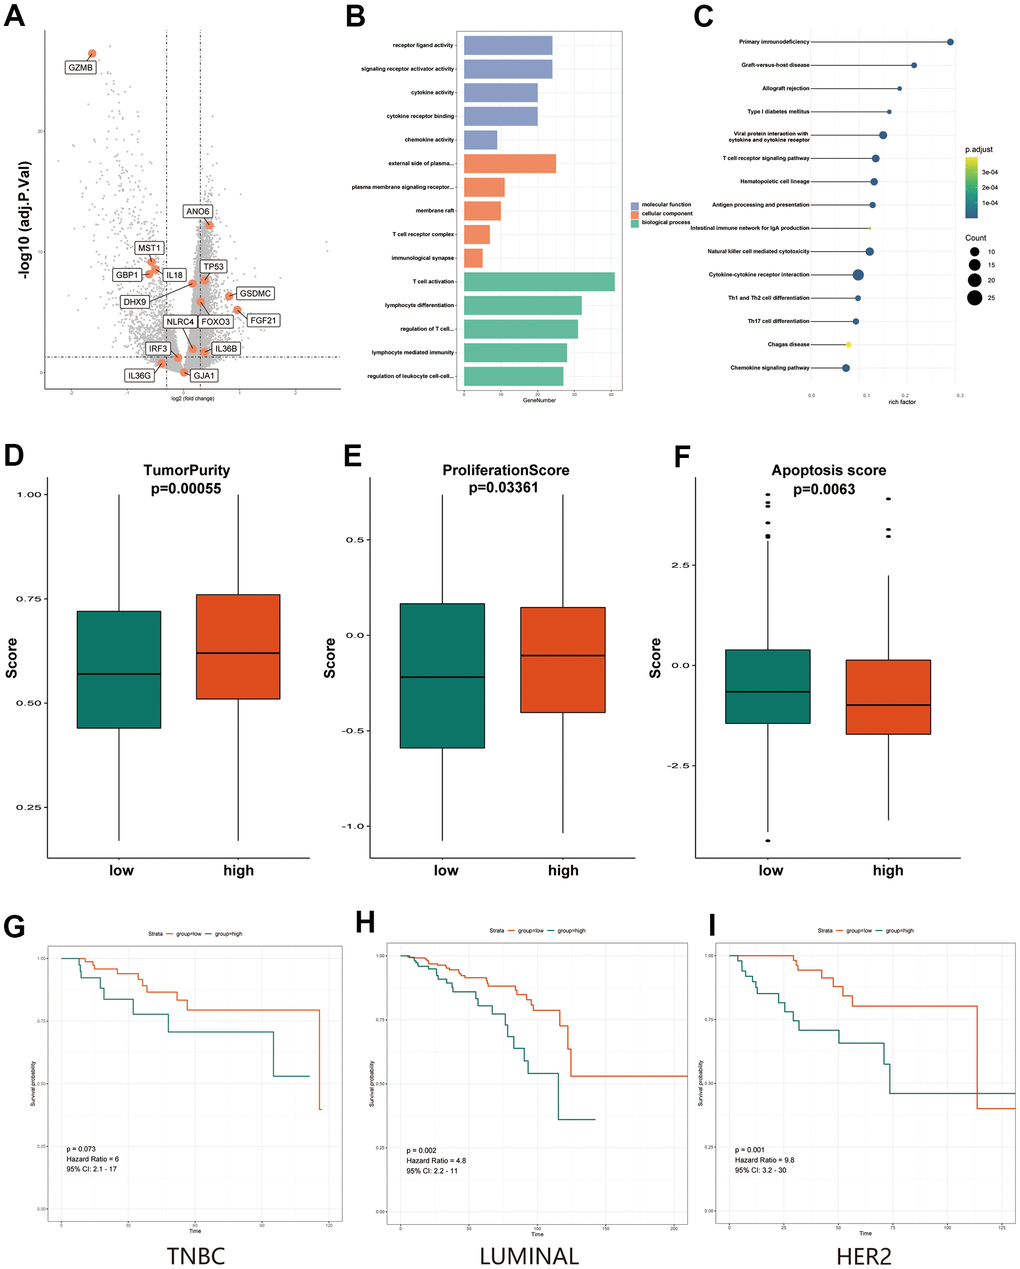
Figure 6.Functional and heterogeneity analysis of 15 pyroptosis-related genes between high- and low-PRS groups. (A) Volcano plot of differentially expressed genes between the low- and high-risk groups. Orange indicates the 15 pyroptosis-related gene signature. (B) The most significant or shared GO enrichment terms in the TCGA cohort. (C) The most significant or shared KEGG pathways in the TCGA cohort. (D) The Boxplots show differences in tumor purity between the high and low-PRS group. (E) The Boxplots show differences in proliferation score between the high and low-PRS group. (F) The Boxplots show differences in apoptosis score between the high and low-PRS group. (G) Results of survival analysis of high- and low- risk groups in TNBC breast cancer patients. (H) Results of survival analysis of high- and low- risk groups in LUMINAL breast cancer patients. (I) Results of survival analysis of high- and low- risk groups in HER2 breast cancer patients. The Kruskal–Wallis test was performed to calculate the P-value. GO, Gene ontology; KEGG, Kyoto Encyclopedia of Genes and Genomes; PRS, pyroptosis-related risk score; High-PRS, high pyroptosis-related risk score; Low-PRS, low pyroptosis-related risk score.