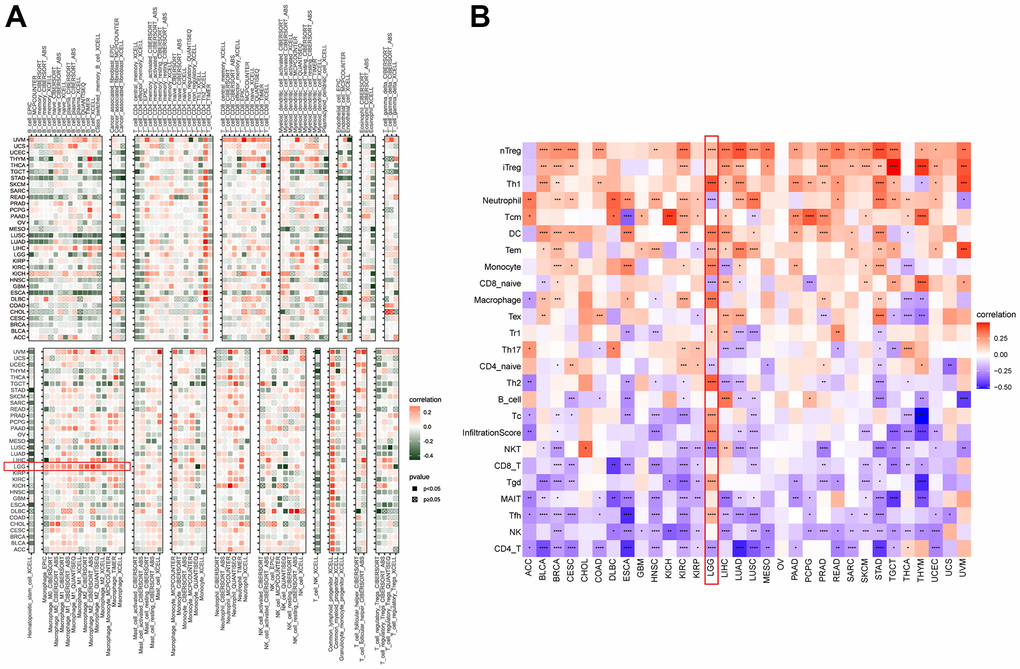
Figure 9.Immune infiltration analysis. (A) The correlation between NUP37 expression and infiltration levels of immune cells downloaded from TIMER2. Red represents positive correlation, green represents negative correlation, and the darker the color, the stronger the correlation. (B) The correlation between NUP37 expression and infiltration levels of immune cells downloaded from ImmuCellAI database. Red represents positive correlation, blue represents negative correlation, and the darker the color, the stronger the correlation. *P < 0.05, **P < 0.01, ***P < 0.001, ****P < 0.0001.