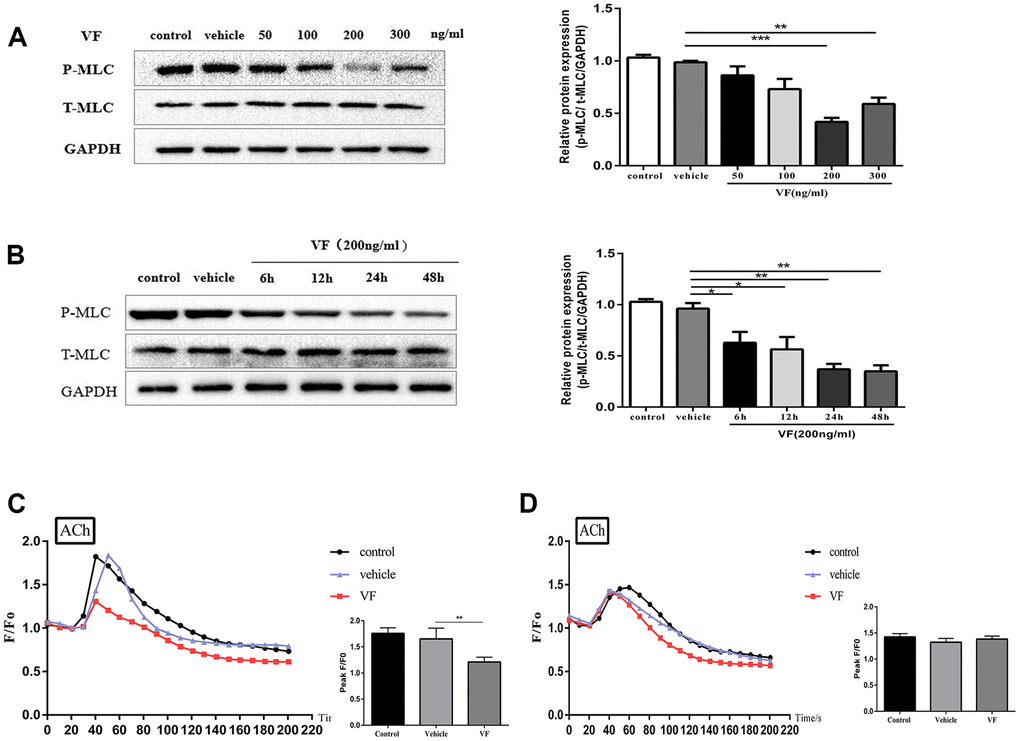
Figure 5.VF reduced MLC phosphorylation and intracellular Ca2+ concentration in isolated colonic smooth muscle cells. (A) CSMCs were treated with vehicle (PBS solution) or 0, 50, 100, 200, and 300 ng/mL VF for 24 h. Western blotting analysis of the phosphorylation of MLC in CSMCs stimulated by 0.1 μM ACh for 30 s. Relative expression was normalized to that of GAPDH. Left panel: Representative image; right panel: Quantitative analysis from three independent experiments. (B) CSMCs were treated with vehicle (PBS solution) or 200 ng/mL VF for 0–48 h. Western blotting analysis of the phosphorylation of MLC in SMCs stimulated by 0.1 μM Ach for 30 s. Relative expression was normalized to that of GAPDH. Left panel: Representative image; right panel: Quantitative analysis from three independent experiments. (C) Changes in fluorescence intensity caused by [Ca2+]i relative to baseline (F/F0) in CSMCs treated with vehicle (PBS solution) or 200 ng/mL VF for 24 h. F0 was derived from the averaged intensity of the first 0–30 seconds. CSMCs were incubated in regular HBSS base buffer. Left panel: Fluorescence intensity of [Ca2+]i; right panel: Quantitative analysis of peak F/F0 and a representative image of fluorescence at peak F/F0 from three independent experiments (three cells in each experiment). (D) Changes in fluorescence intensity caused by [Ca2+]i relative to baseline (F/F0) in CSMCs treated with vehicle (PBS solution) or 200 ng/mL VF for 24 h. F0 was derived from the averaged intensity of the first 0–30 s. CMSCs were incubated in calcium-free HBSS base buffer. Left panel: Fluorescence intensity of [Ca2+]i; right panel: Quantitative analysis of peak F/F0 and a representative image of fluorescence at peak F/F0 from three independent experiments. **P < 0.01, ***P < 0.001.