Submit an Article
Navigate
Home
Editorial Board
Editorial Policies
Current Volume
Archive
Scientific Integrity
Publication Ethics Statements
Interviews with Outstanding Authors
Newsroom
Sponsored Conferences
Podcast
Contact
Special Collections
Submit an Article
Online ISSN: 1945-4589
Research Paper
|
Volume 14, Issue 4
|
pp. 1611–1626
Physiological health indexes predict deterioration and mortality in patients with COVID-19: a comparative study
Back to article
Figure 4
(4 of 5)
−
100%
+
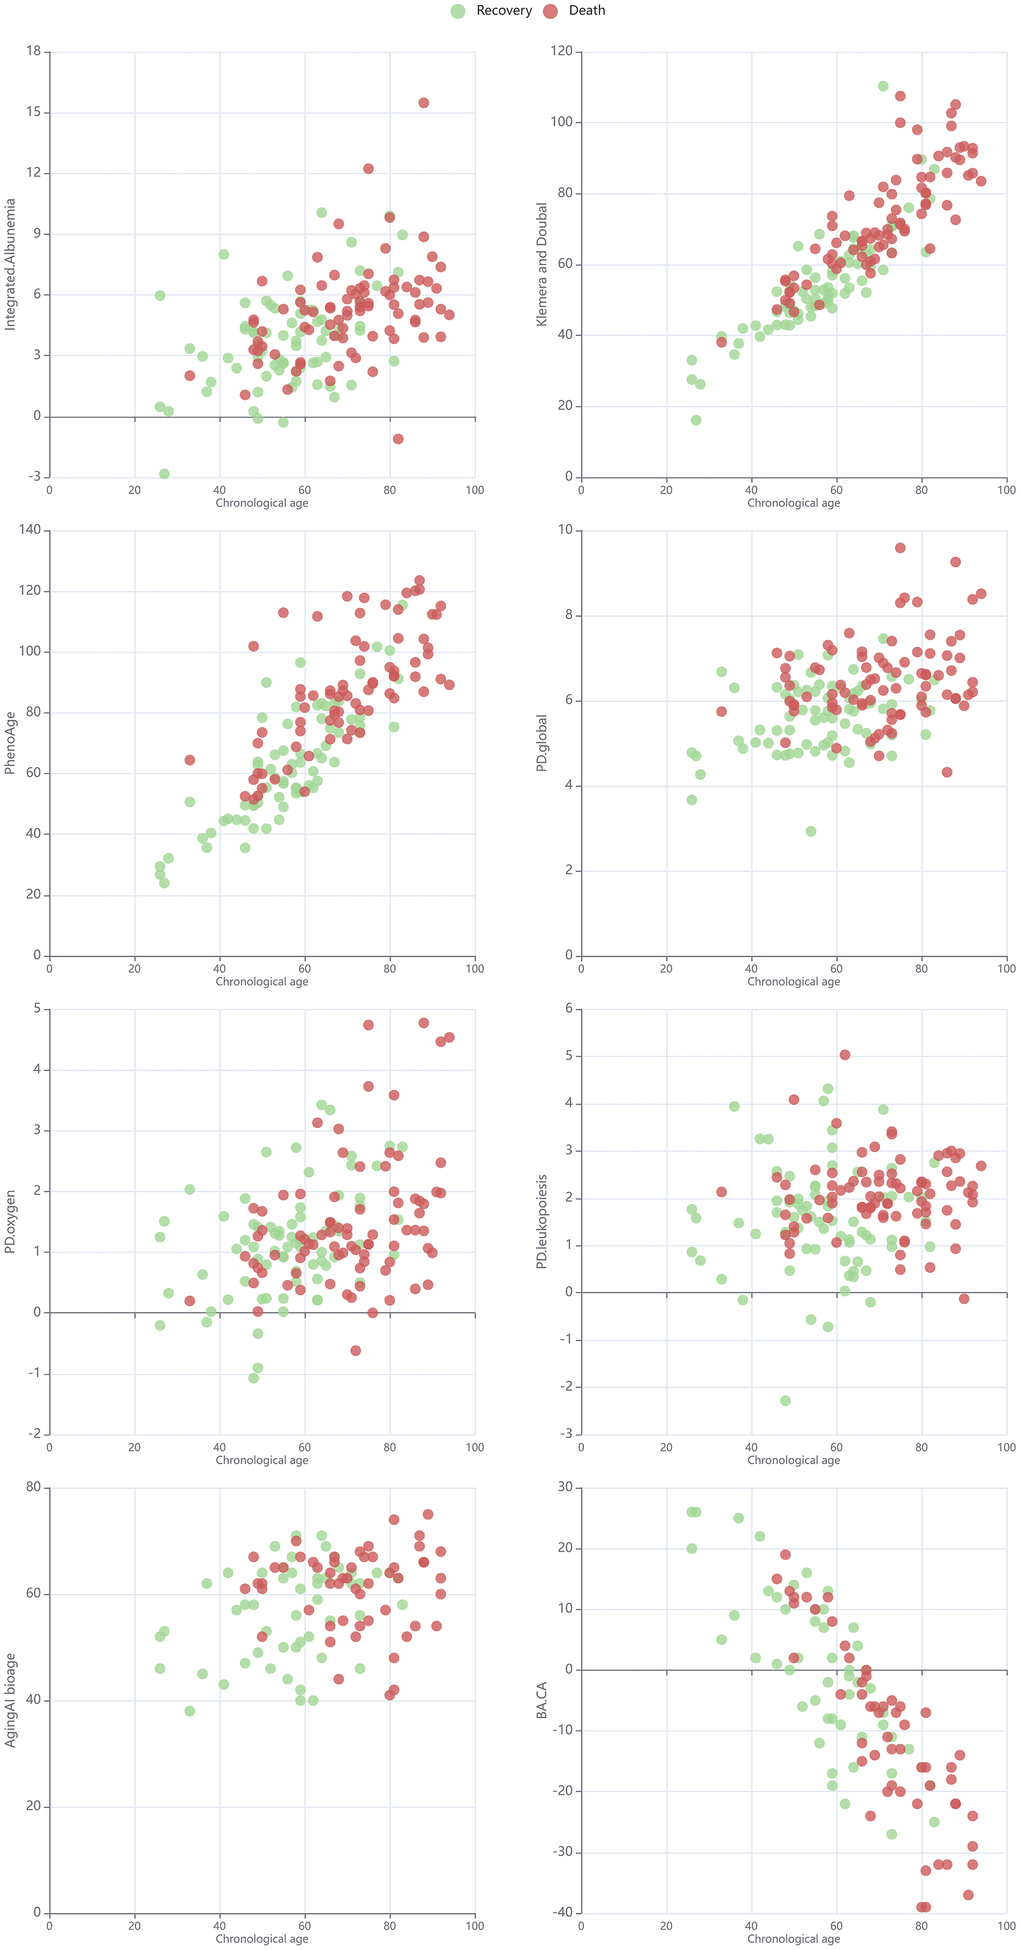
Figure 4.
Scatter plot for chronological age and selected metrics of biological age or physiological state in cohorts split by death/recovery.