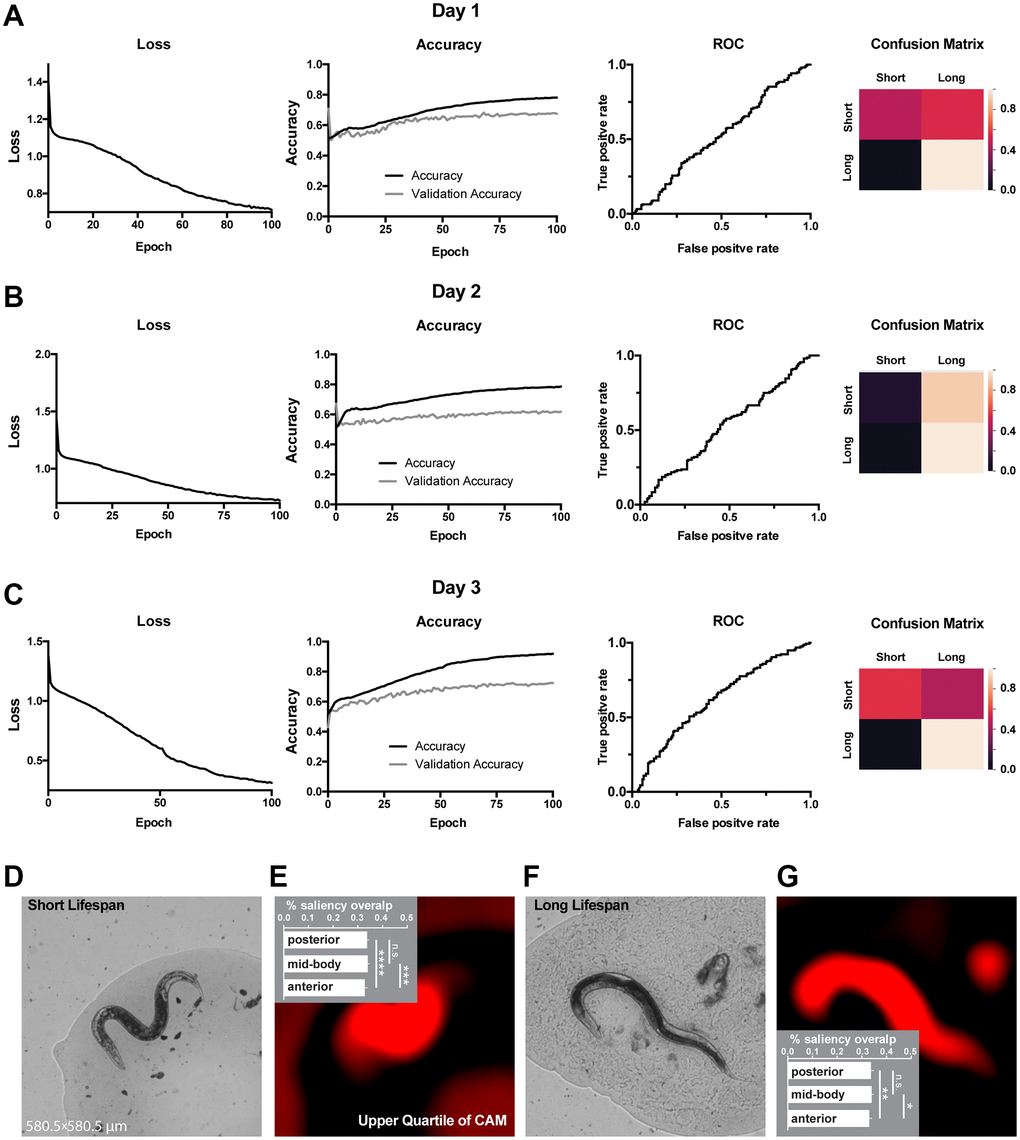
Figure 3.Classification of lifespan from end-point C. elegans micrographs accompanied by by-design-interpretation based on segmentation and saliency union. (A–C) End-point day 1, 2 and 3 (respectively) micrographs classification loss (cost function), accuracy, receiver operating characteristic (ROC) curve, and confusion matrix. Training and test (validation) holdouts are depicted as black and light-grey lines respectively. (D) Short lifespan test micrograph example. (E) Upper quartile of saliency through class activation map (CAM) from image in D accompanied by the quantified by-design-interpretation using HydraNet 4 and CAM union (% saliency overlap). One-way ANOVA with Tukey’s HSD correction. Mean ± SEM, ***p-value <0.001, ****p-value <0.0001. (F) Long lifespan test micrograph example. (G) Upper quartile of saliency through class activation map (CAM) from image in F accompanied by the quantified by-design-interpretation using HydraNet 4 and CAM union (% saliency overlap). One-way ANOVA with Tukey’s HSD correction. Mean ± SEM, *p-value <0.05, **p-value <0.01. Here, the reference size of the field-of-view is 580.5 μm by 580.5 μm.