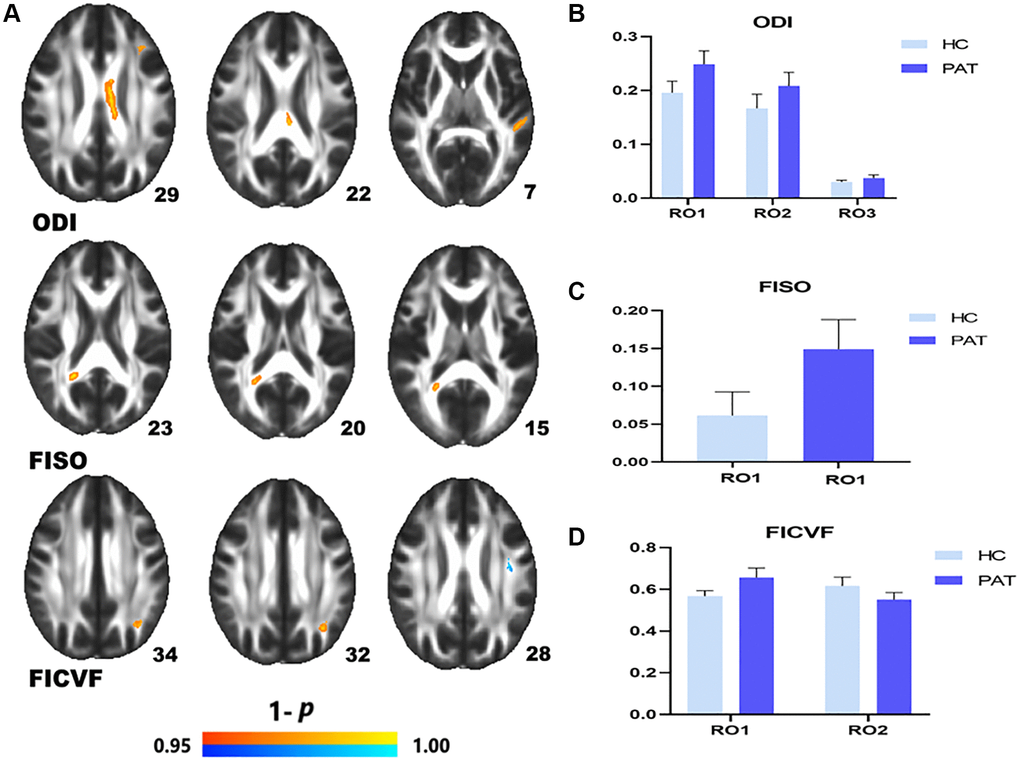
Figure 2.Comparison of NODDI value of HC and PAT group. Mean NODDI values between PAT and HC groups (A–C). (A) ROI1-left anterior corona radiata; ROI2-body of corpus callosum; ROI3-left superior longitudinal fasciculus. (B) Right splenium of corpus callosum. (C) ROI1-left posterior corona radiata; ROI2-left superior longitudinal fasciculus. Significant difference in mean NODDI value between HC and PAT group (D) The red area indicates that the value of PAT is higher than HC and blue areas indicate lower values. Abbreviations: ODI: orientation dispersion index; FISO: isotropic volume fraction; FICVF: intra-cellular volume fraction; HC: healthy controls; PAT: patient; ROI: region of interest.