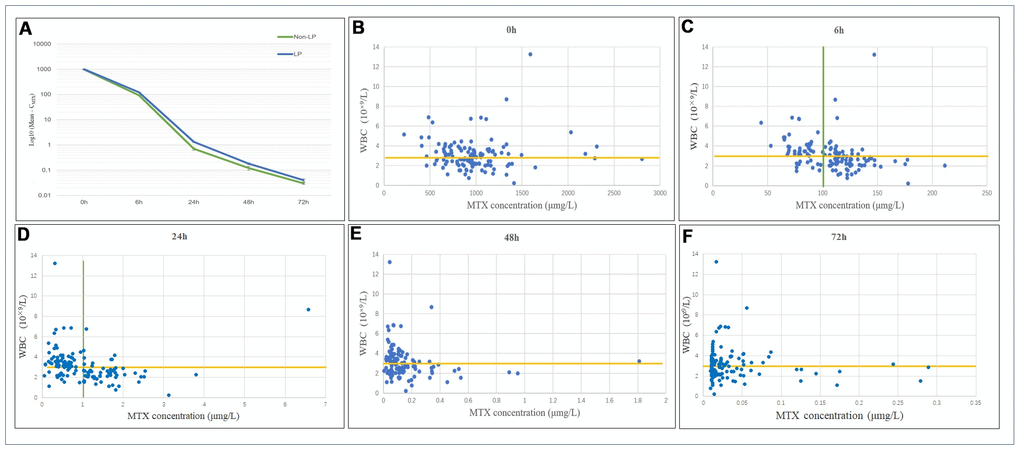
Figure 2.(A) Distribution and variation trends of CMTX. The overall change trend of CMTX at different time points after MTX chemotherapy. LP: the leukopenia group; non-LP: the non-leukopenia group. (B–F) Relationship between CMTX levels and LP at different time points. CMTX concentration at 6h and 24h showed the highest sensitivity and specificity for LP prediction, which were 83.8% and 58.3%, 72.1% and 83.3%, respectively.