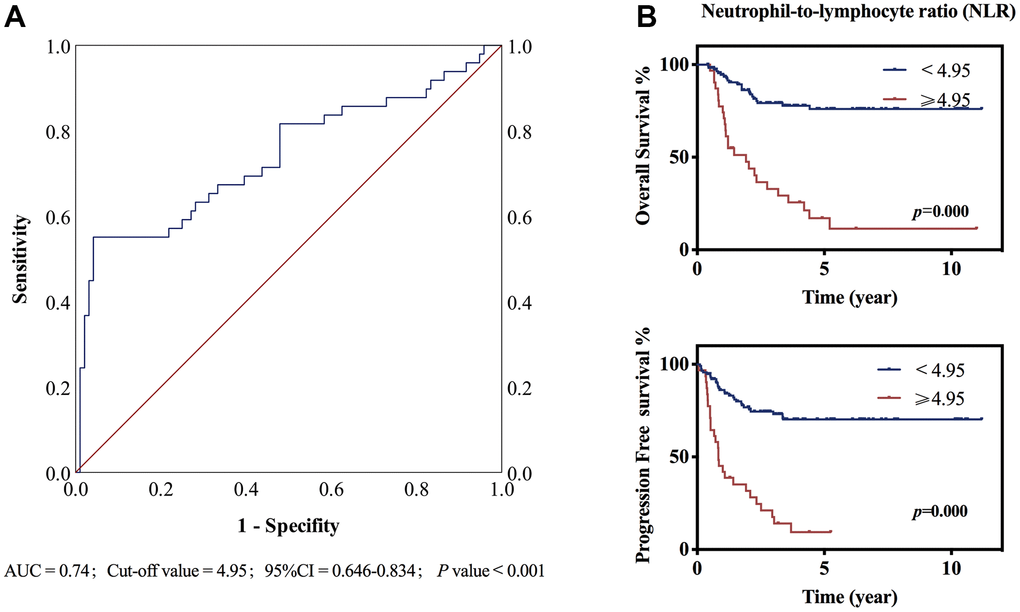
Figure 3.ROC curve and Kaplan–Meier survival curve stratified by NLR. (A) The ROC curve of NLR, the area under the ROC curve (AUC) was 0.74. p<0.001 (B) Neutrophil-to-lymphocyte ratio (NLR) ≥4.95 or <4.95 at diagnosis predicted overall survival and progression free survival. P<0.001.