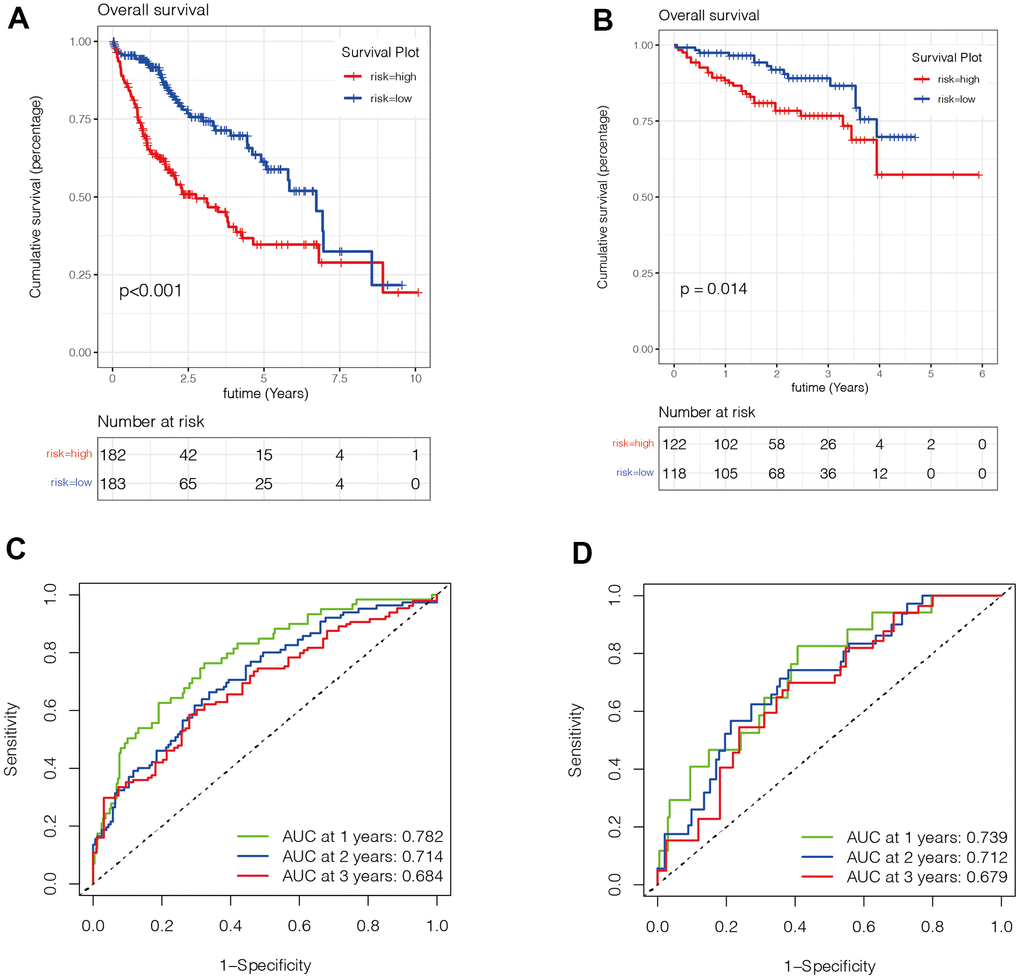
Figure 5.Evaluation of the value of the prognostic model. (A, B) We found that patients in the high-risk group had a poorer prognosis in both the TCGA (Figure 5A) and ICGC (Figure 5B) datasets (P <0.05). (C, D) To verify the accuracy of the risk score in prognostic diagnosis, we plotted the ROC curves for 1, 2, and 3 years in two data sets. We found that the area under the ROC curve of 1 year and 2 years in both data sets was greater than 0.7, and the area under the ROC curve of 3 years was close to 0.7, suggesting that the prognostic model has good stability and accuracy in predicting the prognosis of patients.