Submit an Article
Navigate
Home
Editorial Board
Editorial Policies
Current Volume
Archive
Scientific Integrity
Publication Ethics Statements
Interviews with Outstanding Authors
Newsroom
Sponsored Conferences
Podcast
Contact
Special Collections
Submit an Article
Online ISSN: 1945-4589
Research Paper
|
Volume 14
FCGR2A as one novel potential target for poor survival prognosis of clear cell renal cell carcinoma
Back to article
Figure 1
(1 of 9)
−
100%
+
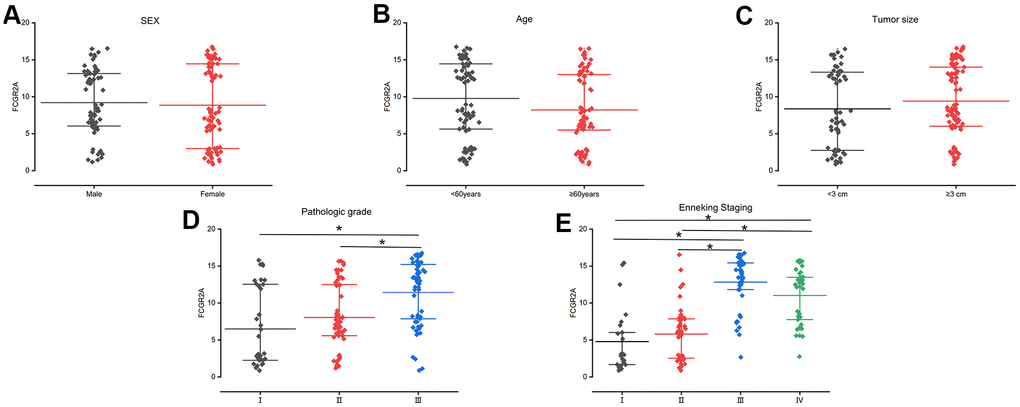
Figure 1.
FCGR2A expression by different scatter plots in different groups.
(
A
) Sex; (
B
) Age; (
C
) Tumor size; (
D
) Pathologic grade; (
E
) Enneking Staging. * represents that the P <0.05.