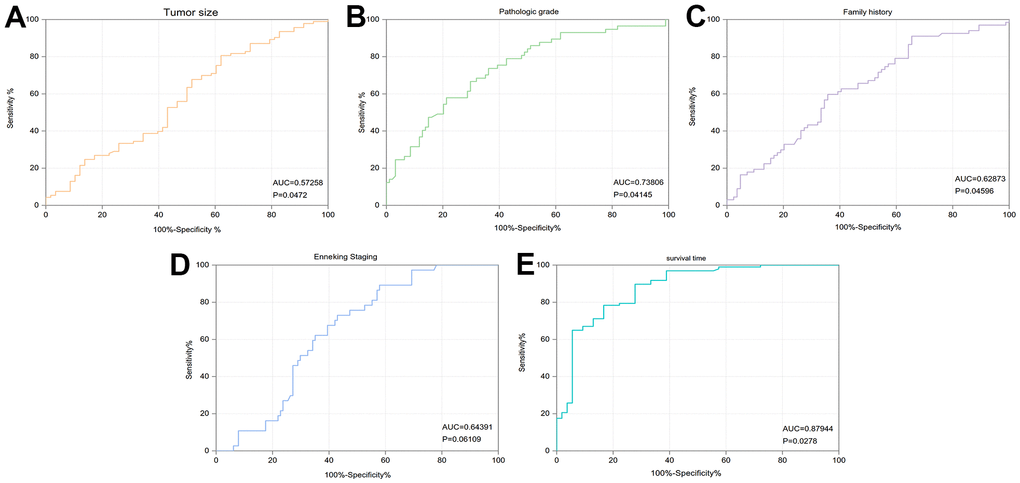
Figure 2.ROC curves to determine the effect of FCGR2A on diagnosing different traits of the ccRCC patients. (A) Tumor size. (B) Pathologic grade. (C) Family history. (D) Enneking Staging. (E) Survival time.
Figure 2 — FCGR2A as one novel potential target for poor survival prognosis of clear cell renal cell carcinoma | Aging