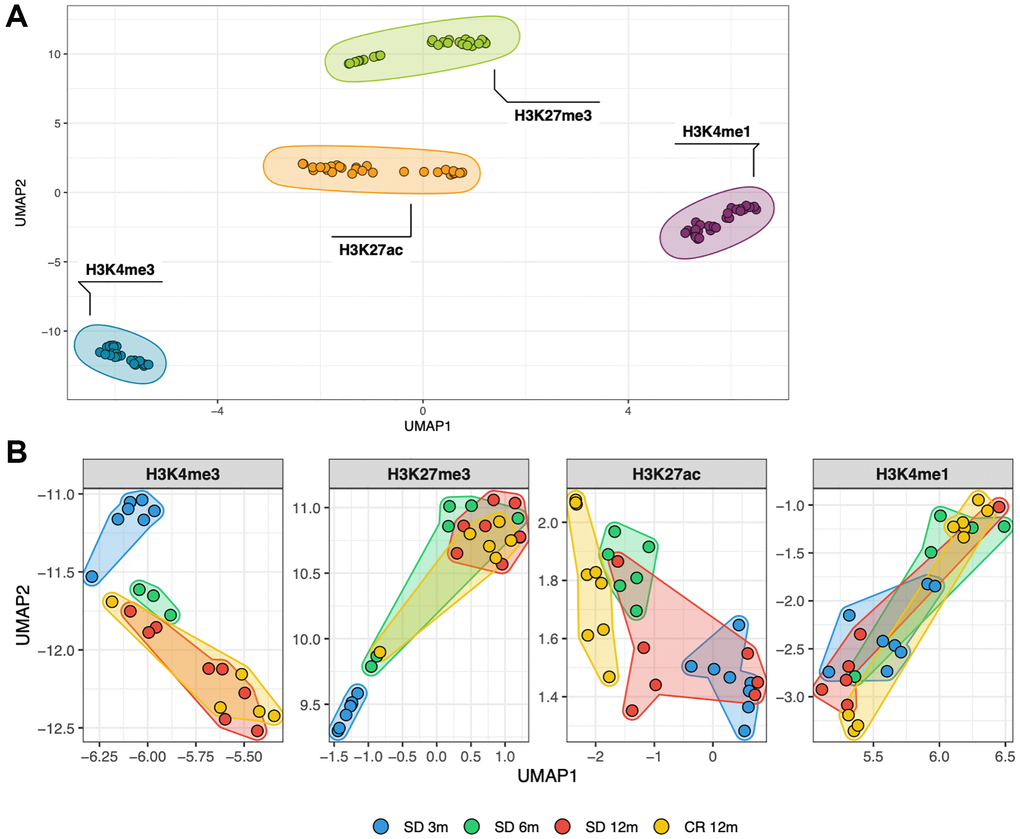
Figure 1.Similarity between all genome-wide histone modifications profiles represented through dimensional reduction using the UMAP algorithm (A), samples are colored by histone modification and aggregate primarily by histone mark. (B), amplification of previous UMAP with samples split by histone mark and colored by the experimental group they belong to (different age and diet).