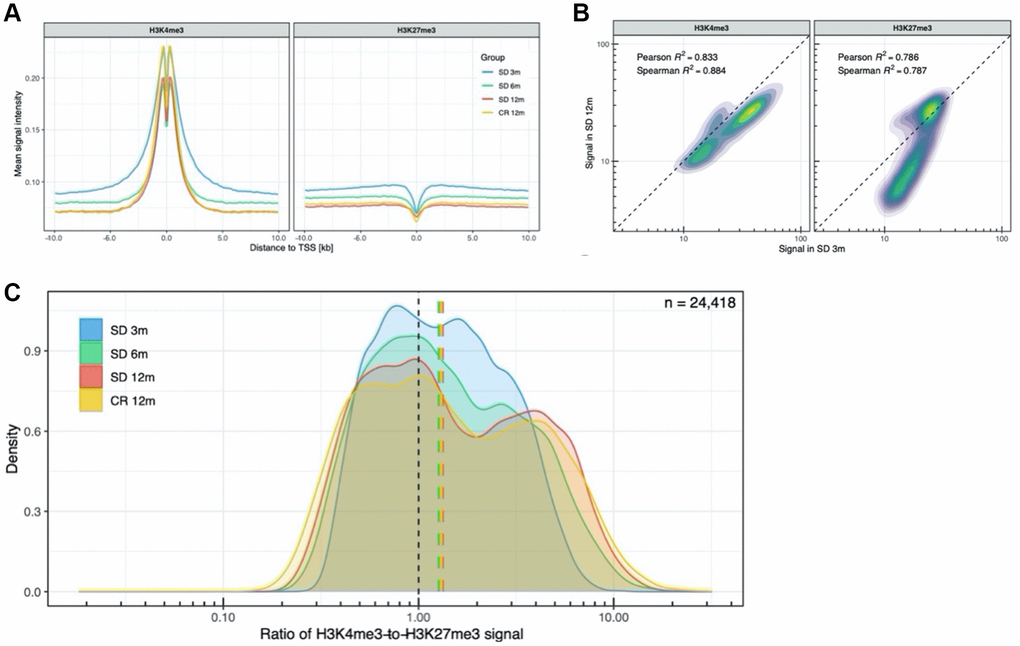
Figure 3.Analysis of promoter-related histone marks in transcription start sites. (A) H3K4me3 and H3K27me3 profiles around all transcription start sites. (B) Density plot of the H3K4me3 and H3K27me3 signal in all TSS, SD 12m over SD 3m. (C) Distribution of H3K4me3-to-H3K27me3 signal ratio across all TSS.