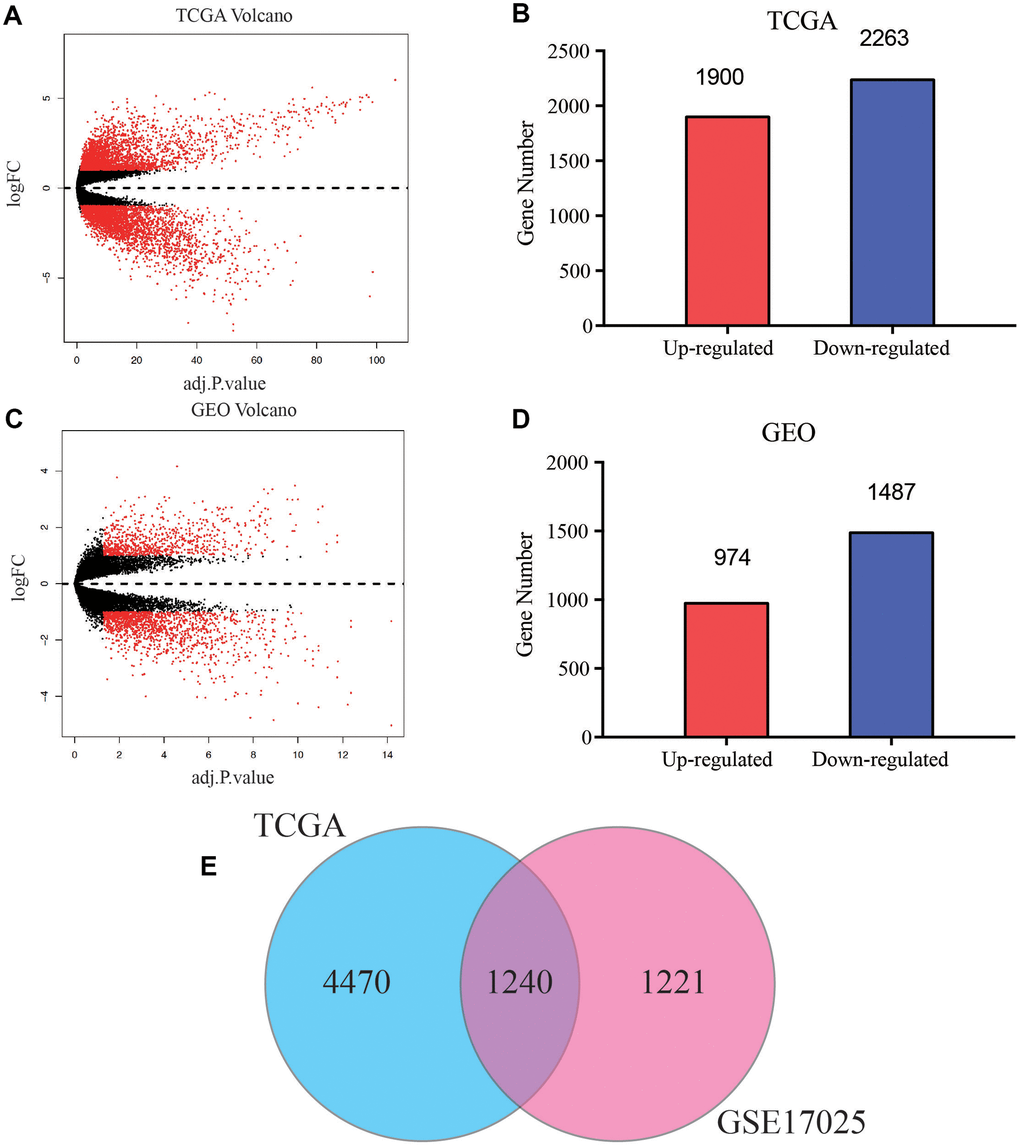
Figure 2.Screening of common differentially expressed genes (DEGs) of TCGA and GEO databases. (A) Volcano plot of DEGs between EC and normal endometrial samples in TCGA database. (B) Bar plot for DEGs of dysregulated genes in TCGA database. Red bar, up-regulated mRNA, blue bar, down-regulated mRNA. (C) Volcano plot of DEGs between EC and normal endometrial samples in GSE17025. (D) Bar plot for DEGs of dysregulated genes in GSE17025. (E) Venn diagram of DEGs between TCGA and GEO databases, the blue circle represents for total number of DEGs in TCGA, and the pink circle represents for total number of DEGs in GSE17025, the overlapped part is used for further analysis.