


Introduction
Endometrial carcinoma (EC) is a common female malignant tumor, which has increasingly become a burden in the world and China [1]. In the past decade, the number of Chinese women diagnosed with EC has increased significantly, which may be attributed to higher rates of obesity, diabetes, hypertension, aging, early menarche, and late menopause [2]. EC comes from proliferative endometrium (type I, endometrioid) or atrophic endometrium (type II, non-endometrioid), which are related to estrogen [3]. However, most of the women diagnosed with EC are postmenopausal women aged 60 to 70, and 56% of women with type I were diagnosed after menopause, which indicates that estrogen is not decisive risk factor for patients with type I EC [4, 5]. There is an urgent need to study its mechanism underlying postmenopausal women with type I EC and to discover new prognostic molecular biomarkers.
Advancements in high-throughput microarray technology have made it possible to identify genes associated with EC progress using gene expression profiling [6], though studies using these techniques have assessed differentially expressed genes (DEGs) and have not considered the relationship between them. In these cases, genes with similar patterns of expression could be associated with each other. There are limitations in selecting DEGs only between normal and cancer samples, and we should pay more attention to the association between gene expression and clinical characteristics. Weighted gene co-expression network analysis (WGCNA) is commonly used to characterize the relationships between genes and can identify associations that are highly correlated [7]. WGCNA would classify genes with similar functions in the same module by gene expression profiling, and summarize the identified modules by the module eigengene, relating eigengene network to one another and to clinical features. It has been commonly used to identify hub genes in the following cancers: clear cell renal cell carcinoma (ccRCC) [8], pancreatic ductal adenocarcinoma [9], and breast cancer [10].
Due to the limitation of experiment, the development of huge public transcriptome database provides an excellent platform for cancer research, screening biomarkers associated with prognosis and clinicopathological characteristics [11]. Machine learning methods have been developed using RNA-sequencing patterns, which can be used to develop models for accurate classification and prediction in medical settings. Different subtypes of EC are quite different in terms of molecular characteristics and treatments [12].
In the current study, we hoped to reveal the potential mechanism of tumorigenesis in postmenopausal women with type I EC. We constructed a correlation network of DEGs from publicly accessible resources by WGCNA, and identified a gene module that had a close association with postmenopausal status. Furthermore, risk model was constructed and validated in TCGA dataset. Finally, we analyzed the PKD1 expression levels in tissues from patients with premenopausal or postmenopausal status and explored the mechanical value of PKD1 in EC patients.
Materials and Methods
Data collection
The Cancer Genome Atlas (TCGA) UCSC XENA (https://xena.ucsc.edu/) and the Gene Expression Omnibus (GEO) database were used to obtain clinical data and gene expression profiles. Affymetrix Human Gene 2.0 ST Array was used to process the GSE17025 dataset. The level of TCGA gene expression was measured as Transcripts per million reads (TPM). The data of this study are from GEO and TCGA public databases.
Identifications of differentially expressed genes (DEGs)
The GSE17025 expression profile was normalized and analyzed using R software and the limma package, while the TCGA EC dataset was normalized and analyzed using R software and the edge R package. Cut-off criteria were considered the |log2 Fold Change (log2FC)| >1 and adjusted p-value <0.05.
Construction of WGCNA and module preservation
We applied the WGCNA to construct the gene co-expression network and identify the co-expression modules in R software [7]. In this study, we selected the minimum size (genome) 30 for the gene tree, the cutting line of 0.25 for the module tree, and combined some modules. We assessed how similar the module eigengenes (MEs) were, identified a cut line for the module dendrogram, and merged certain modules to better understand the module.
Identification of clinically significant modules
Real hub genes were selected by drawing a Venn diagram which combining the module, DEGs in GEO database (p < 0.05, log2FC>1), and DEGs in TCGA database (p < 0.05, log2FC>1) together. The expression similarity of different samples is used to identify the WGCNA, while the relationship between the external clinicopathological information and the gene modules is used to identify clinically significant modules. Finally, gene modules that were highly correlated with certain clinical features were chosen as modules of interest for further analysis. Functional and pathway enrichment analysis of significant module was conducted according to the methods previously reported [13]. P < 0.05 was set as the cut off criterion.
In vitro validation of hub genes
Total protein of different types of tissues were extracted and used for western blot as described earlier [6]. Total RNA was extracted from tissues using TRIzol reagent (Tiangen, China). We used the PrimeScript RT-polymerase (Vazyme) to reverse-transcribe cDNAs to the mRNA of interest. Real-time quantitative RT-PCR (qRT-PCR) was conducted using SYBR-Green Premix (Vazyme) with specific PCR primers (Thermo Fisher Scientific, USA). GAPDH was taken as an internal control. The relative expression of the target gene was calculated using the 2−ΔΔCt method. qRT-PCR was performed according to the manufacturer’s instructions.
Statistical analysis
Statistical differences in the expression of hub genes in the normal and tumor samples were analyzed using a two-tailed student’s t-test in both the TCGA and GEO databases. All statistical tests and graphing were performed using R software and GraphPad prism 7.0. All analyses were conducted three times and represented data form three separate experiments. P value <0.05 was considered statistically significant.
Results
Identification of DEGs in GEO and TCGA databases
A brief study design was shown in Figure 1. The DEGs in both of the GEO and TCGA datasets were analyzed respectively using p < 0.05 and |log2FC| >1 as the cutoff criteria. The volcano maps of the DEGs in the two groups were constructed using the R package. Based on the screening guidelines, 4163 DEGs were acquired, consisting of 1900 up-regulated genes and 2263 down-regulated genes from EC tissues compared with normal endometrial tissues in TCGA dataset (Figure 2A, 2B). What’s more, we found a total of 2461 DEGs in the normal endometrial tissue in GSE17025, including 1487 downregulated and 974 upregulated genes (Figure 2C, 2D). In total, 1240 common genes are acquired by Venn diagram (Figure 2E).
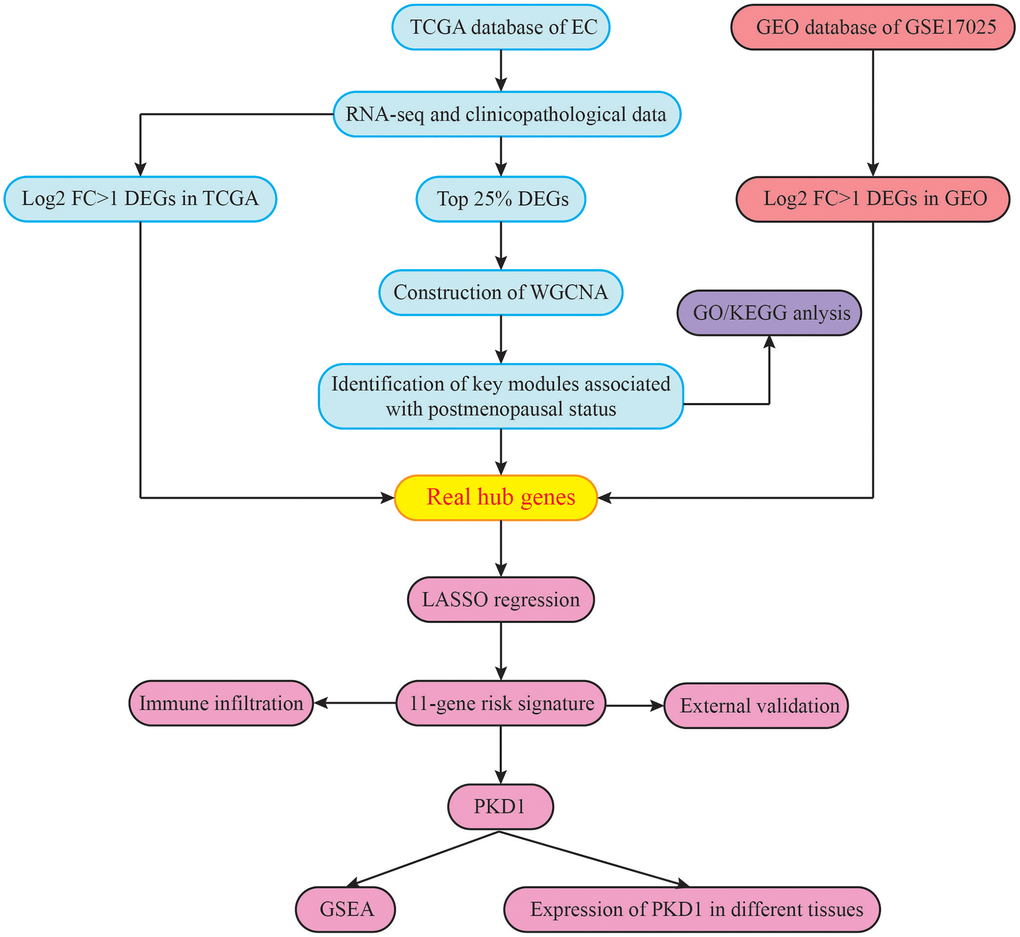
Figure 1. The flowchart of the study design.
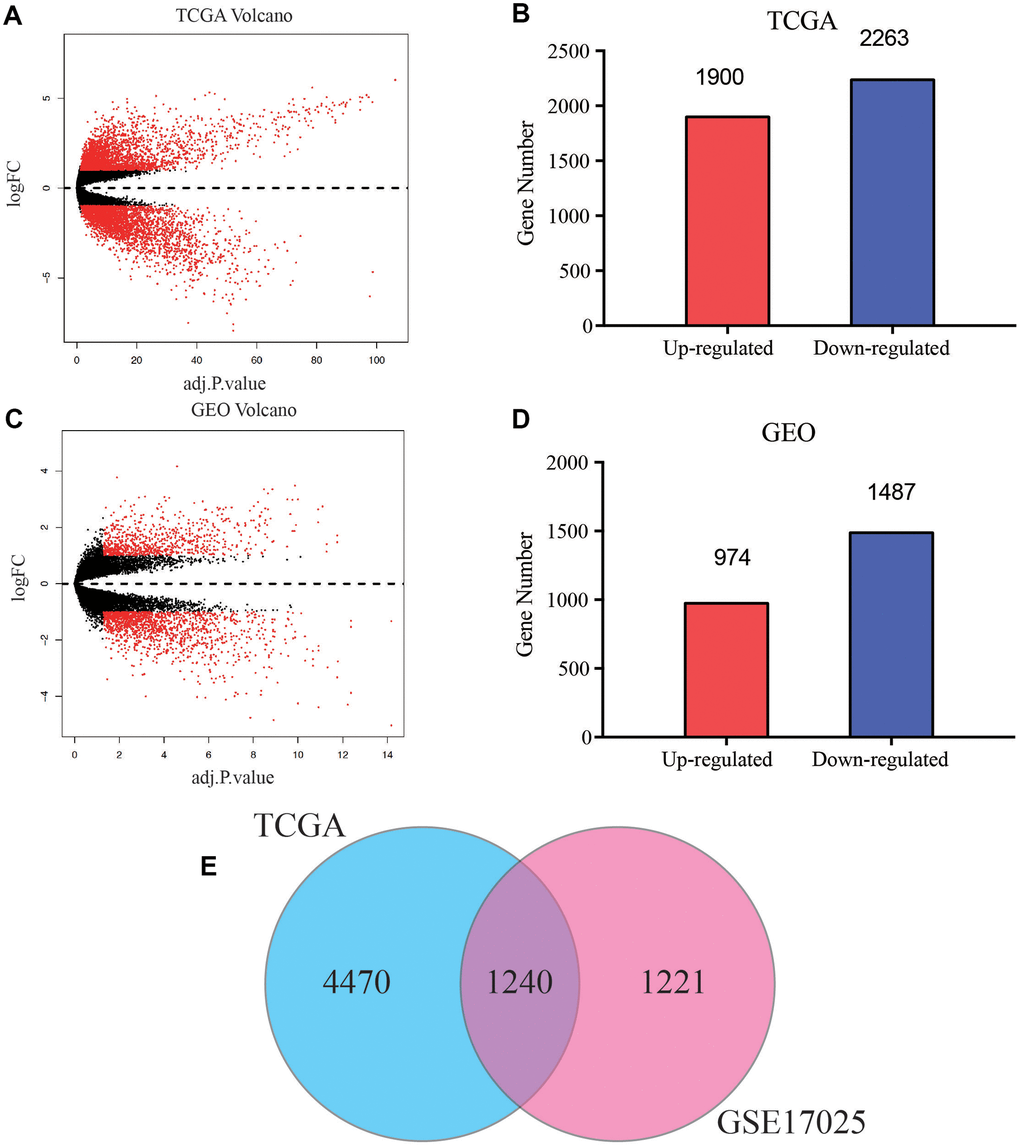
Figure 2. Screening of common differentially expressed genes (DEGs) of TCGA and GEO databases. (A) Volcano plot of DEGs between EC and normal endometrial samples in TCGA database. (B) Bar plot for DEGs of dysregulated genes in TCGA database. Red bar, up-regulated mRNA, blue bar, down-regulated mRNA. (C) Volcano plot of DEGs between EC and normal endometrial samples in GSE17025. (D) Bar plot for DEGs of dysregulated genes in GSE17025. (E) Venn diagram of DEGs between TCGA and GEO databases, the blue circle represents for total number of DEGs in TCGA, and the pink circle represents for total number of DEGs in GSE17025, the overlapped part is used for further analysis.
WGCNA and identification of key modules
We constructed co-expression network by TCGA dataset including 545 EC samples associated with whole clinical information. When constructing co-expression network with “WGCNA” software package, the expression value of the first 25% DEG is included. In our study, β = 4 (scale free R2 = 0.89) was selected as the soft-thresholding power to ensure a scale-free network (Figure 3A–3C). All selected genes were classified using the dissimilarity measure based on topological overlap matrix (TOM), which is based on the dynamic tree cutting algorithm and divides the tree into eight modules marked with different colors (Figure 3D). We identified the relationship between each module and the EC clinical information, with a particular emphasis on postmenopausal status (Figure 3E). Pearson’s correlation coefficient was used to assess the association between the co-expression modules in this study. Modules with various gene clusters were labeled in the topological overlap heatmap using different colors, with blue indicating a negative relationship and red indicating a positive relationship (Figure 3F). Then 1000 genes were randomly selected for the heatmap. Results of the clustering analysis indicated that the hierarchical clustering of the module eigengenes was representative of the modules. The dendrogram branches were clustered according to the eigengene relationships (Figure 3G).
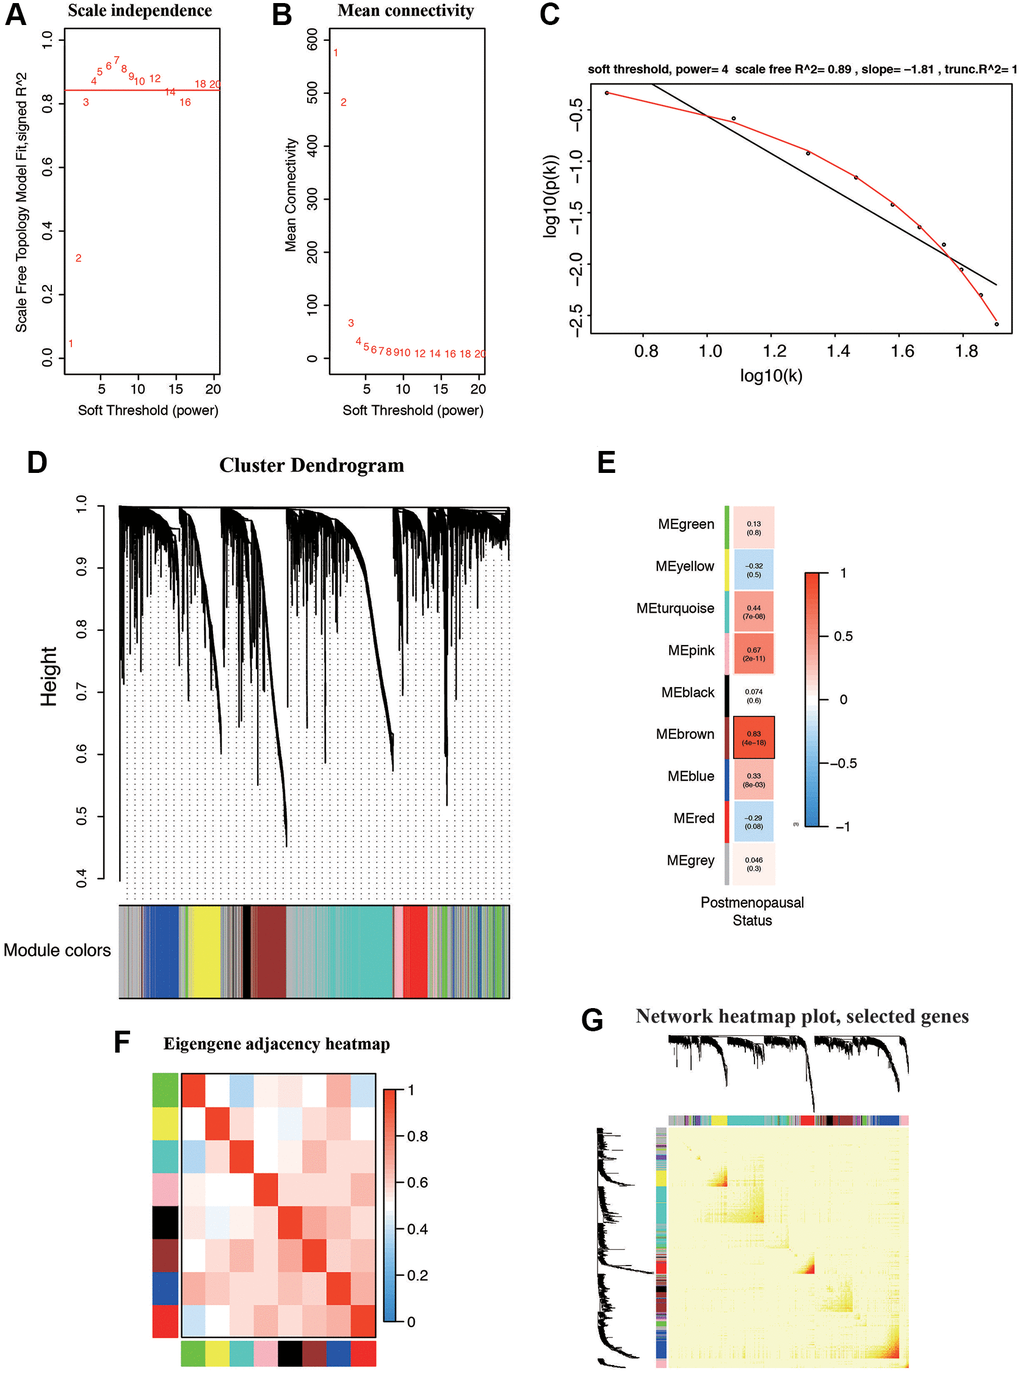
Figure 3. Weighted gene correlation network (WGCNA) on the RNA-seq database and selection of hub genes. (A, B) Screening and validation of the soft threshold. (C) Checking the scale free topology when β = 4. The x-axis demonstrates the logarithm of whole network connectivity, while the y-axis shows the logarithm of the corresponding frequency distribution. (D) Clustering dendrogram of common DEGs in EC tissues. (E) Correlation between modules and postmenopausal status. (F) Correlations between different modules. (G) Heatmap depicts the Topological Overlap Matrix (TOM) of genes selected for WGCNA. Light color represents lower overlap and deep color represents higher overlap.
First, modules with a greater MS were considered to have more connection with patients in postmenopausal status. However, most of the correlations were between low and moderate (R2 < 0.5), and the MS of the brown module (R2 = 0.83, P = 4e-18) was found to be higher than that of the rest of the modules. Therefore, the brown module with postmenopausal status was identified as the clinically significant module, which was extracted for further analysis.
GO and pathway enrichment analysis of hub genes in brown module
GO and KEGG enrichment analysis were used to explore the function and pathways of the hub genes. The brown module, which consisted of 471 genes, was mainly associated with the following subclasses of GO classification (Figure 4A): calcium ion binding, translational initiation, integral component of plasma membrane, and cell adhesion. KEGG pathway analysis showed that top enriched terms were P53 signaling pathway, cell adhesion molecules, T cell receptor signaling pathway, and chemical carcinogenesis (Figure 4B). These suggested that brown module genes were closely related to the calcium channel and cell adhesion.

Figure 4. Functional analysis of common DEGs from TCGA and GSE17025 datasets. (A) GO analysis showing the differentially expressed postmenopausal related genes. (B) The significantly enriched pathways of the DEGs determined by KEGG analysis. Abbreviations: GO: gene ontology; KEGG: Kyoto Encyclopedia of Genes and Genomes.
Establishment and validation of a postmenopausal related prognostic signature
For screening out the potentially prognostic biomarkers for patients with postmenopausal status, LASSO regression was conducted. LASSO analyses identified 11 genes significantly associated with prognosis: PKD1, PCDHB15, PRND, TBC1D8B, ZNF578, SLC26A4, CACNA1D, CPEB1, CYP46A1, EPPK1, and KBTBD12 (Figure 5A, 5B). According to the results of LASSO regression analysis, we used the coefficients (Table 1) to construct the prognostic model as following: risk score = (PKD1 × 0.13192805) − (PCDHB15 × 0.082172079) − (PRND × 0.026889625) − (TBC1D8B × 0.093931462) − (ZNF578 × 0.048951829) + (SLC26A4 × 0.209421425) + (CACNA1D × 0.372518929) + (CPEB1 × 0.045936749) + (CYP46A1 × 0.039213661) + (EPPK1 × 0.019827739) − (KBTBD12 × 0.025230047). The patients were then ranked, in ascending order, according to the parameter, after which they were classified into low-risk and high-risk groups based on the median risk values. We further analyzed the relationship between the 11 genes (Figure 5C). We found that they were significantly relevant, especially between PKD1 and ZNF578, PKD1 and SLC26A4, CACNA1D and ZNF578, SLC26A4 and PRND. In addition, the expression of 11 genes in TCGA dataset in low-risk and high-risk patients was also confirmed in the heatmap. The expression profiles of the prognostic genes showed that PKD1, SLC26A4, CACNA1D, CPEB1, CYP46A1, and EPPK1 were highly expressed in the high-risk subgroup. We observed significant differences in the high- and low-risk groups related to peritoneal cytology, histology, menopause, tumor LNM, recurrence, grade, age, stage, and death status (Figure 5D). The dot plot displays the ranked risk score and survival status of each individual, with notable differences between the groups in terms of overall survival (OS) (Figure 5E, 5F). Kaplan-Meier curve analysis indicated that the OS of the high-risk group was significantly shorter than that of the low-risk group (P = 1.827e−05, Figure 5G). Analysis of the ROC curve indicated that the area under the ROC curve (AUC) of the prognostic HRGs model for OS was 0.729 (Figure 5H). These results demonstrated that the menopause-related risk signature had a high precision in the prediction of EC patients.
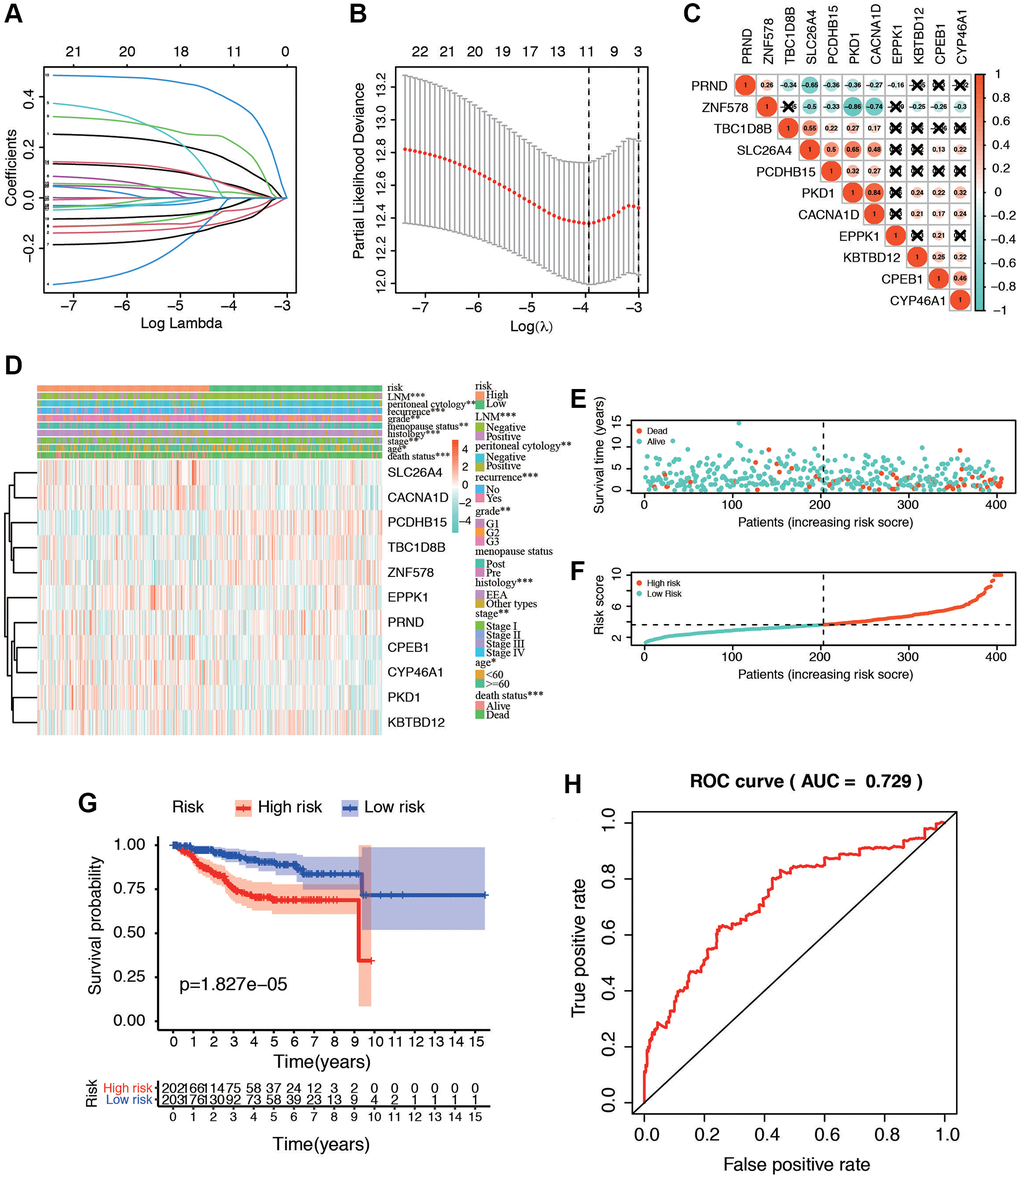
Figure 5. Identification of postmenopausal related prognostic signature in EC patients. (A) Plots of the ten-fold cross-validation error rates. (B) LASSO coefficient profiles of the eleven postmenopausal related genes. (C) Spearman correlation analysis with the selected 11 genes. (D) Heatmap and clinicopathological features of high- and low-risk groups. The samples are ordered by risk score, and the score decreases from left to right. (E, F) Risk score distribution in low- and high-risk groups. (G) Kaplan-Meier survival analysis of the low and high-risk group. (H) Time-dependent ROC curves for overall survival prediction for EC patients.
Table 1. Eleven postmenopause-associated genes and corresponding coefficient values.
| Metabolic associated gene | Coefficient |
| PKD1 | 0.13192805 |
| PCDHB15 | −0.0821721 |
| PRND | −0.0268896 |
| TBC1D8B | −0.0939315 |
| ZNF578 | −0.0489518 |
| SLC26A4 | 0.20942142 |
| CACNA1D | 0.37251893 |
| CPEB1 | 0.04593675 |
| CYP46A1 | 0.03921366 |
| EPPK1 | 0.01982774 |
| KBTBD12 | −0.02523 |
| Risk score | Low: <3.63 |
| High: ≥3.63 |
The risk signature mentioned above was further validated in the clinical cohort in our center (Supplementary Table 1). We conducted the RNA level sequencing of 30 EC patients and calculated the risk score of each patient with the formula mentioned above. EC patients in the cohort were divided into low- and high-risk groups based on the median risk score as before. Expression of PKD1 was compared between patients with pre- and postmenopausal status (Supplementary Figure 1A). Kaplan-Meier survival curves showed that patients with low risk scores had a longer OS, which was consistent with the predicted survival results of the risk model (p = 0.031) (Supplementary Figure 1B).
Verification of expression of PKD1 in database and in vitro
We further validated the expression of PKD1 in different clinicopathological characteristics of EC patients in TCGA database. The results indicated that PKD1 was highly expressed in cancer tissue, grade 3, positive lymph node metastasis, positive peritoneal cytology, and recurrence groups (Figure 6A–6E). Patients were divided into two cohorts according to median value of PKD1. The results indicated that the expression of PKD1 was significantly associated with patient prognosis (Figure 6F). The analysis showed that PKD1 was statistically different in worse outcomes of EC patients. GSEA results showed that high expression of PKD1 was enriched in apoptosis, and low expression of PKD1 was enriched in B cell receptor signaling pathway, endometrial cancer, mTOR signaling pathway, and VEGF signaling pathway (Supplementary Figure 2). The immune infiltration was significant diverse in different expression of PKD1 (Supplementary Figure 3). To further explore the expression of PKD1 in different menopause status, we performed the qPCR and western blot (WB) validation in clinical specimens following the steps described above. As shown in Figure 7A, 7B, the expression levels of PKD1 in postmenopausal patients was more than that in the premenopausal patients in EC group. These results indicated that PKD1 may play a pivotal role in EC especially in postmenopausal women.
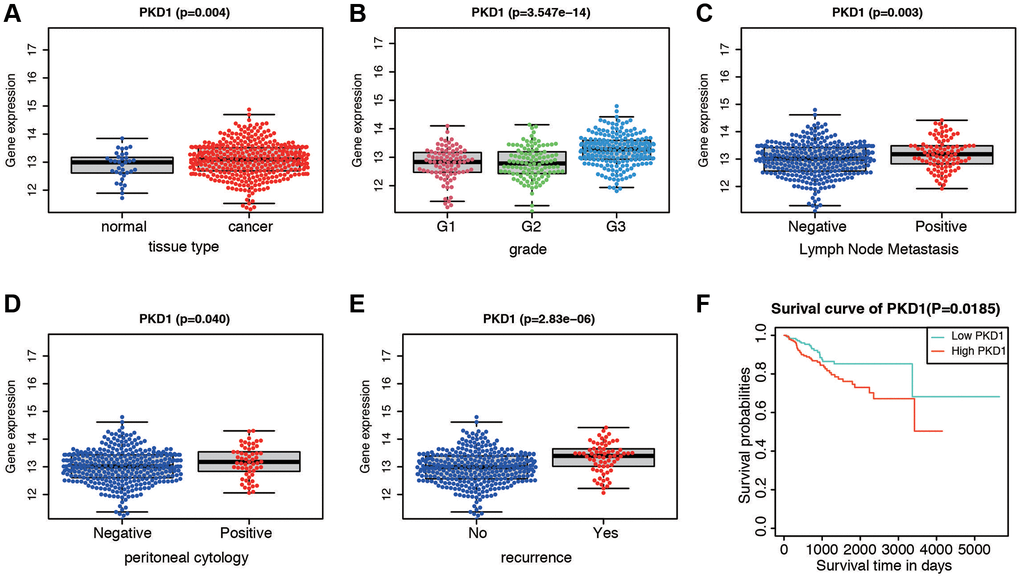
Figure 6. Expression and survival validation of PKD1 in TCGA database. Expression of PKD1 in different clinicopathological features. (A) Normal and cancer tissues. (B) Different grade. (C) Positive and negative lymph node metastasis. (D) Positive and negative peritoneal cytology. (E) Different recurrence status. (F) Kaplan-Meier survival plot of low and high expression of PKD1 according to the median value.
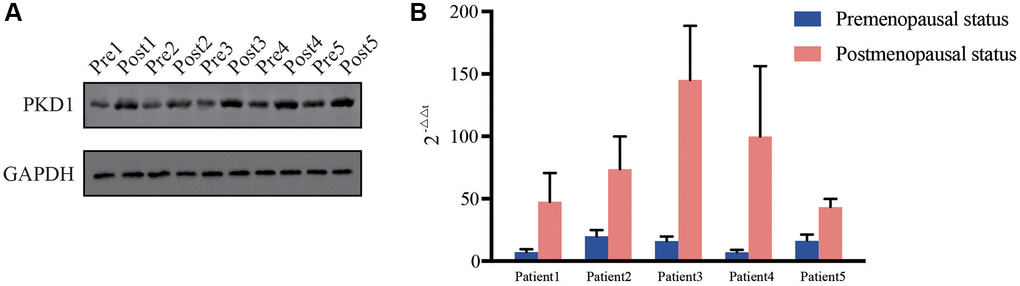
Figure 7. Relative expression of PKD1 in 5 pairs of pre- and post-menopausal patients in our center for (A) protein level and (B) RNA level. Pre, premenopausal status, Post, postmenopausal status.
Discussion
The purpose of the present study was to screen out gene modules and hub genes that played a pivotal role in EC patients with postmenopausal status by WGCNA and LASSO analysis using the resources in TCGA and GEO databases. In this study, we identified a 471-gene module that had significant association with postmenopausal status by bioinformatics method and further revealed an 11-gene risk signature in this cluster. These risk model might act as an essential part in EC patients with postmenopausal status.
WGCNA had been used to distinguish related hub gene, biological pathway and tumor therapeutic target for complex diseases, such as familial genetic disease [14], Alzheimer’s disease [15], and many types of cancers [16, 17]. Co-expression network analysis as a powerful tool is also applied to study EC. Several modules and genes revealed by WGCNA analysis were reported to have an influence on pathological traits such as grade, stage, and prognosis [18, 19]. Other researches involved postmenopausal status belonged to clinical epidemiological investigation [20]. These studies either concentrated on pathological features associated genes or epidemiological characteristics of postmenopausal patients, but did not proclaim the mechanism that had an effect on postmenopausal EC patients.
According to the current literature, our findings identified the brown module, and further GO/KEGG analysis indicated that the biological mechanism of the brown module was closely associated with “calcium ion binding”, “P53 signaling pathway”, and “Cell adhesion molecules”. Calcium ion, especially calcium channel was correlated with risk and prognosis in EC [21]. Different cancers were linked to the expression of different calcium channels, such as TRPM7 in breast cancer [22] and TRPM4 in prostate cancer [23]. Previous study found that calcium ion and TRPV4 was required for calcium influx and contributes broadly to the development of endometrial cancer [24]. Calcium channel might also involve in tumorigenesis in postmenopausal EC patients. What’s more, p53 is thought to be an important tumor suppressor that influences multiple crucial biological processes, including apoptosis, cell-cycle arrest, and DNA repair [25]. More than 60% of patients with endometrial cancer develop TP53 mutations [12]; and mutant p53 proteins may not only abolish their tumor-suppressive functions, but also acquire oncogenic functions [26]. Cell adhesion could contribute to the invasive behavior of EC cells, and the underlying mechanism was related to TGFβ1-MEK-ERK1/2-integrin αvβ3 signaling pathway [27].
Protein kinase D1 (PKD1) is a serine threonine kinase and an important regulator of many kinase signal transduction pathways [28]. Previous studies have shown that PKD1 promoted breast cancer cell proliferation and estrogen independence [29, 30]. PKD1 is a serine/threonine kinase encoded by the PRKD1 gene [31], which can regulate various biological processes, including cell proliferation, survival, movement, Golgi tissue and membrane transport [32, 33]. In addition, endometrial cancer and breast cancer were both estrogen-mediated cancer. However, the underlying signaling mechanisms in EC are largely unknown. Some studies have shown that PKD1 stimulates NFκB, an important transcription factor involved in a variety of cellular mechanisms that plays a role in increasing the proliferation and growth rate of pancreatic cancer [34]. PKD1 had also been reported to be involved in the Notch signaling pathway [35]. During the transgenic model induced by KRAS12D, the expression of PKD1 contributes to the formation of precancerous lesions, indicating that PKD1 plays an essential role in the origination and progression of cancer cells [36]. Our study suggested that PKD1 was overexpressed in postmenopausal women compared with premenopausal women in protein and RNA levels. The mechanisms underlying PKD1 were associated with apoptosis, B cell receptor signaling pathway, endometrial cancer, mTOR signaling pathway, and VEGF signaling pathway. Together, these results suggest that PKD1 could be a potential therapeutic target in EC.
There were several risk signatures and biomarkers for predicting the prognosis of EC patients in different features aspects [37–39]. One study constructed a 5 cell cycle-related genes signature to evaluate prognosis of EC patients, and the AUC of 5-year survival reached to 0.733 [40]. A separate study found that gene signature models related to immunity in both EC and cervical cancer are effective at assessing patient prognosis and risk, which justifies future research into immunology [41]. However, as to the feature of postmenopausal status, there were no such risk models. Therefore, our signature was the first model associated with postmenopausal status and the validation proved to be highly precise in predicting OS in EC patients. Additionally, we used 30 patients from our center to validate the risk model. Our results demonstrate that this risk model is valuable for both clinical diagnosis and prognosis, while PKD1 could serve as a hub gene involved in EC progression.
To the best of our knowledge, there are no studies exploring the influence of menopausal status of EC, and this model helped us to recognize a new promising biomarker, PKD1 for EC from a clinical perspective. Additionally, this study reported a variety of bioinformatics methods that expose PKD1 as a novel therapeutic target for the treatment of EC patients, and validated with our own samples in RNA and protein levels, highlighting the potential of this molecular for therapeutic candidate discovery.
However, there are several limitations in our study. First of all, this is a retrospective study, and this risk signature is developed from two online databases, but not our own samples, and this risk model should be further validated by large-group sequencing. Secondly, our study assesses menopause in EC patients, though other clinicopathological characteristics are important during oncological pathologies. These must be integrated and studied to better understand tumorigenesis and its progression in EC patients. Lastly, the specific mechanism regulating PKD1 in EC cells must be further studied both in vitro and in vivo, and how it affects metastasis in EC patients requires further attention.
Conclusion
In conclusion, we performed a WGCNA approach integrating TCGA and GEO databases, and constructed a gene co-expression network to reveal a postmenopausal specific module and potential molecular mechanism underlying the tumorigenesis for EC. Furthermore, an 11-gene signature is constructed and validated. Finally, PKD1 was identified as potential biomarker that played a key role in the progression of EC with postmenopausal status.
Author Contributions
Conceptualization: Yun Cheng; Data curation: Suyun Zhang; Formal analysis: Yun Cheng; Investigation: Yan Qiang; Methodology: Yan Qiang and Lingyan Dong; Resources: Lingyan Dong; Validation: Yun Cheng; Writing – original draft: Yun Cheng and Yujuan Li; Writing – review and editing: Suyun Zhang and Yun Cheng.
Acknowledgments
We would like to acknowledge TCGA database for free use.
Conflicts of Interest
The authors declare no conflicts of interest related to this study.
Funding
This work was supported by the Science and Technology Support Plan of Cangzhoou (Grant No. 204106095).
Editorial Note
This corresponding author has a verified history of publications using a personal email address for correspondence
References
- 1. Cao W, Chen HD, Yu YW, Li N, Chen WQ. Changing profiles of cancer burden worldwide and in China: a secondary analysis of the global cancer statistics 2020. Chin Med J (Engl). 2021; 134:783–91. https://doi.org/10.1097/CM9.0000000000001474 [PubMed]
- 2. Setiawan VW, Yang HP, Pike MC, McCann SE, Yu H, Xiang YB, Wolk A, Wentzensen N, Weiss NS, Webb PM, van den Brandt PA, van de Vijver K, Thompson PJ, et al, and Australian National Endometrial Cancer Study Group. Type I and II endometrial cancers: have they different risk factors? J Clin Oncol. 2013; 31:2607–18. https://doi.org/10.1200/JCO.2012.48.2596 [PubMed]
- 3. Ulrich LS. Endometrial cancer, types, prognosis, female hormones and antihormones. Climacteric. 2011; 14:418–25. https://doi.org/10.3109/13697137.2010.550974 [PubMed]
- 4. Gao Y, Zhao M, Dai X, Tong M, Wei J, Chen Q. The prevalence of endometrial cancer in pre- and postmenopausal Chinese women. Menopause. 2016; 23:884–7. https://doi.org/10.1097/GME.0000000000000684 [PubMed]
- 5. Akhmedkhanov A, Zeleniuch-Jacquotte A, Toniolo P. Role of exogenous and endogenous hormones in endometrial cancer: review of the evidence and research perspectives. Ann N Y Acad Sci. 2001; 943:296–315. https://doi.org/10.1111/j.1749-6632.2001.tb03811.x [PubMed]
- 6. Li XC, Cheng Y, Yang X, Zhou JY, Dong YY, Shen BQ, Wang JQ, Zhao LJ, Wang ZQ, Li XP, Wang JL. Decreased expression of TRPM4 is associated with unfavorable prognosis and aggressive progression of endometrial carcinoma. Am J Transl Res. 2020; 12:3926–39. [PubMed]
- 7. Langfelder P, Horvath S. WGCNA: an R package for weighted correlation network analysis. BMC Bioinformatics. 2008; 9:559. https://doi.org/10.1186/1471-2105-9-559 [PubMed]
- 8. Yuan L, Zeng G, Chen L, Wang G, Wang X, Cao X, Lu M, Liu X, Qian G, Xiao Y, Wang X. Identification of key genes and pathways in human clear cell renal cell carcinoma (ccRCC) by co-expression analysis. Int J Biol Sci. 2018; 14:266–79. https://doi.org/10.7150/ijbs.23574 [PubMed]
- 9. Zhou Z, Cheng Y, Jiang Y, Liu S, Zhang M, Liu J, Zhao Q. Ten hub genes associated with progression and prognosis of pancreatic carcinoma identified by co-expression analysis. Int J Biol Sci. 2018; 14:124–36. https://doi.org/10.7150/ijbs.22619 [PubMed]
- 10. Tang J, Kong D, Cui Q, Wang K, Zhang D, Gong Y, Wu G. Prognostic Genes of Breast Cancer Identified by Gene Co-expression Network Analysis. Front Oncol. 2018; 8:374. https://doi.org/10.3389/fonc.2018.00374 [PubMed]
- 11. Kandoth C, McLellan MD, Vandin F, Ye K, Niu B, Lu C, Xie M, Zhang Q, McMichael JF, Wyczalkowski MA, Leiserson MDM, Miller CA, Welch JS, et al. Mutational landscape and significance across 12 major cancer types. Nature. 2013; 502:333–9. https://doi.org/10.1038/nature12634 [PubMed]
- 12. Kandoth C, Schultz N, Cherniack AD, Akbani R, Liu Y, Shen H, Robertson AG, Pashtan I, Shen R, Benz CC, Yau C, Laird PW, Ding L, et al, and Cancer Genome Atlas Research Network. Integrated genomic characterization of endometrial carcinoma. Nature. 2013; 497:67–73. https://doi.org/10.1038/nature12113 [PubMed]
- 13. Li X, Yang X, Fan Y, Cheng Y, Dong Y, Zhou J, Wang Z, Li X, Wang J. A ten-gene methylation signature as a novel biomarker for improving prediction of prognosis and indicating gene targets in endometrial cancer. Genomics. 2021; 113:2032–44. https://doi.org/10.1016/j.ygeno.2021.04.035 [PubMed]
- 14. Feng X, Zhu L, Qin Z, Mo X, Hao Y, Jiang Y, Hu W, Li S. Temporal transcriptome change of Oncomelania hupensis revealed by Schistosoma japonicum invasion. Cell Biosci. 2020; 10:58. https://doi.org/10.1186/s13578-020-00420-4 [PubMed]
- 15. Mukherjee S, Klaus C, Pricop-Jeckstadt M, Miller JA, Struebing FL. A Microglial Signature Directing Human Aging and Neurodegeneration-Related Gene Networks. Front Neurosci. 2019; 13:2. https://doi.org/10.3389/fnins.2019.00002 [PubMed]
- 16. Xu P, Yang J, Liu J, Yang X, Liao J, Yuan F, Xu Y, Liu B, Chen Q. Identification of glioblastoma gene prognosis modules based on weighted gene co-expression network analysis. BMC Med Genomics. 2018; 11:96. https://doi.org/10.1186/s12920-018-0407-1 [PubMed]
- 17. Chen L, Yuan L, Wang Y, Wang G, Zhu Y, Cao R, Qian G, Xie C, Liu X, Xiao Y, Wang X. Co-expression network analysis identified FCER1G in association with progression and prognosis in human clear cell renal cell carcinoma. Int J Biol Sci. 2017; 13:1361–72. https://doi.org/10.7150/ijbs.21657 [PubMed]
- 18. Liu J, Zhou S, Li S, Jiang Y, Wan Y, Ma X, Cheng W. Eleven genes associated with progression and prognosis of endometrial cancer (EC) identified by comprehensive bioinformatics analysis. Cancer Cell Int. 2019; 19:136. https://doi.org/10.1186/s12935-019-0859-1 [PubMed]
- 19. Chou WC, Cheng AL, Brotto M, Chuang CY. Visual gene-network analysis reveals the cancer gene co-expression in human endometrial cancer. BMC Genomics. 2014; 15:300. https://doi.org/10.1186/1471-2164-15-300 [PubMed]
- 20. Clarke MA, Long BJ, Del Mar Morillo A, Arbyn M, Bakkum-Gamez JN, Wentzensen N. Association of Endometrial Cancer Risk With Postmenopausal Bleeding in Women: A Systematic Review and Meta-analysis. JAMA Intern Med. 2018; 178:1210–22. https://doi.org/10.1001/jamainternmed.2018.2820 [PubMed]
- 21. Fonseca BM, Correia-da-Silva G, Teixeira NA. Cannabinoid-induced cell death in endometrial cancer cells: involvement of TRPV1 receptors in apoptosis. J Physiol Biochem. 2018; 74:261–72. https://doi.org/10.1007/s13105-018-0611-7 [PubMed]
- 22. Liu H, Dilger JP, Lin J. The Role of Transient Receptor Potential Melastatin 7 (TRPM7) in Cell Viability: A Potential Target to Suppress Breast Cancer Cell Cycle. Cancers (Basel). 2020; 12:131. https://doi.org/10.3390/cancers12010131 [PubMed]
- 23. Sagredo AI, Sagredo EA, Pola V, Echeverría C, Andaur R, Michea L, Stutzin A, Simon F, Marcelain K, Armisén R. TRPM4 channel is involved in regulating epithelial to mesenchymal transition, migration, and invasion of prostate cancer cell lines. J Cell Physiol. 2019; 234:2037–50. https://doi.org/10.1002/jcp.27371 [PubMed]
- 24. Li X, Cheng Y, Wang Z, Zhou J, Jia Y, He X, Zhao L, Dong Y, Fan Y, Yang X, Shen B, Wu X, Wang J, et al. Calcium and TRPV4 promote metastasis by regulating cytoskeleton through the RhoA/ROCK1 pathway in endometrial cancer. Cell Death Dis. 2020; 11:1009. https://doi.org/10.1038/s41419-020-03181-7 [PubMed]
- 25. Vogelstein B, Lane D, Levine AJ. Surfing the p53 network. Nature. 2000; 408:307–10. https://doi.org/10.1038/35042675 [PubMed]
- 26. Liu Y, Zhao R, Chi S, Zhang W, Xiao C, Zhou X, Zhao Y, Wang H. UBE2C Is Upregulated by Estrogen and Promotes Epithelial-Mesenchymal Transition via p53 in Endometrial Cancer. Mol Cancer Res. 2020; 18:204–15. https://doi.org/10.1158/1541-7786.MCR-19-0561 [PubMed]
- 27. Xiong S, Klausen C, Cheng JC, Leung PCK. TGFβ1 induces endometrial cancer cell adhesion and migration by up-regulating integrin αvβ3 via SMAD-independent MEK-ERK1/2 signaling. Cell Signal. 2017; 34:92–101. https://doi.org/10.1016/j.cellsig.2017.03.010 [PubMed]
- 28. Jaggi M, Rao PS, Smith DJ, Hemstreet GP, Balaji KC. Protein kinase C mu is down-regulated in androgen-independent prostate cancer. Biochem Biophys Res Commun. 2003; 307:254–60. https://doi.org/10.1016/s0006-291x(03)01161-6 [PubMed]
- 29. Karam M, Legay C, Auclair C, Ricort JM. Protein kinase D1 stimulates proliferation and enhances tumorigenesis of MCF-7 human breast cancer cells through a MEK/ERK-dependent signaling pathway. Exp Cell Res. 2012; 318:558–69. https://doi.org/10.1016/j.yexcr.2012.01.001 [PubMed]
- 30. Karam M, Bièche I, Legay C, Vacher S, Auclair C, Ricort JM. Protein kinase D1 regulates ERα-positive breast cancer cell growth response to 17β-estradiol and contributes to poor prognosis in patients. J Cell Mol Med. 2014; 18:2536–52. https://doi.org/10.1111/jcmm.12322 [PubMed]
- 31. Rozengurt E, Rey O, Waldron RT. Protein kinase D signaling. J Biol Chem. 2005; 280:13205–8. https://doi.org/10.1074/jbc.R500002200 [PubMed]
- 32. Merzoug-Larabi M, Spasojevic C, Eymard M, Hugonin C, Auclair C, Karam M. Protein kinase C inhibitor Gö6976 but not Gö6983 induces the reversion of E- to N-cadherin switch and metastatic phenotype in melanoma: identification of the role of protein kinase D1. BMC Cancer. 2017; 17:12. https://doi.org/10.1186/s12885-016-3007-5 [PubMed]
- 33. Rozengurt E. Protein kinase D signaling: multiple biological functions in health and disease. Physiology (Bethesda). 2011; 26:23–33. https://doi.org/10.1152/physiol.00037.2010 [PubMed]
- 34. Liou GY, Döppler H, DelGiorno KE, Zhang L, Leitges M, Crawford HC, Murphy MP, Storz P. Mutant KRas-Induced Mitochondrial Oxidative Stress in Acinar Cells Upregulates EGFR Signaling to Drive Formation of Pancreatic Precancerous Lesions. Cell Rep. 2016; 14:2325–36. https://doi.org/10.1016/j.celrep.2016.02.029 [PubMed]
- 35. Döppler H, Panayiotou R, Reid EM, Maimo W, Bastea L, Storz P. The PRKD1 promoter is a target of the KRas-NF-κB pathway in pancreatic cancer. Sci Rep. 2016; 6:33758. https://doi.org/10.1038/srep33758 [PubMed]
- 36. Kumari S, Khan S, Sekhri R, Mandil H, Behrman S, Yallapu MM, Chauhan SC, Jaggi M. Protein kinase D1 regulates metabolic switch in pancreatic cancer via modulation of mTORC1. Br J Cancer. 2020; 122:121–31. https://doi.org/10.1038/s41416-019-0629-9 [PubMed]
- 37. Rižner TL. Discovery of biomarkers for endometrial cancer: current status and prospects. Expert Rev Mol Diagn. 2016; 16:1315–36. https://doi.org/10.1080/14737159.2016.1258302 [PubMed]
- 38. Li J, Dowdy S, Tipton T, Podratz K, Lu WG, Xie X, Jiang SW. HE4 as a biomarker for ovarian and endometrial cancer management. Expert Rev Mol Diagn. 2009; 9:555–66. https://doi.org/10.1586/erm.09.39 [PubMed]
- 39. Jiang SW, Li J, Podratz K, Dowdy S. Application of DNA methylation biomarkers for endometrial cancer management. Expert Rev Mol Diagn. 2008; 8:607–16. https://doi.org/10.1586/14737159.8.5.607 [PubMed]
- 40. Liu J, Mei J, Li S, Wu Z, Zhang Y. Establishment of a novel cell cycle-related prognostic signature predicting prognosis in patients with endometrial cancer. Cancer Cell Int. 2020; 20:329. https://doi.org/10.1186/s12935-020-01428-z [PubMed]
- 41. Ding H, Fan GL, Yi YX, Zhang W, Xiong XX, Mahgoub OK. Prognostic Implications of Immune-Related Genes' (IRGs) Signature Models in Cervical Cancer and Endometrial Cancer. Front Genet. 2020; 11:725. https://doi.org/10.3389/fgene.2020.00725 [PubMed]