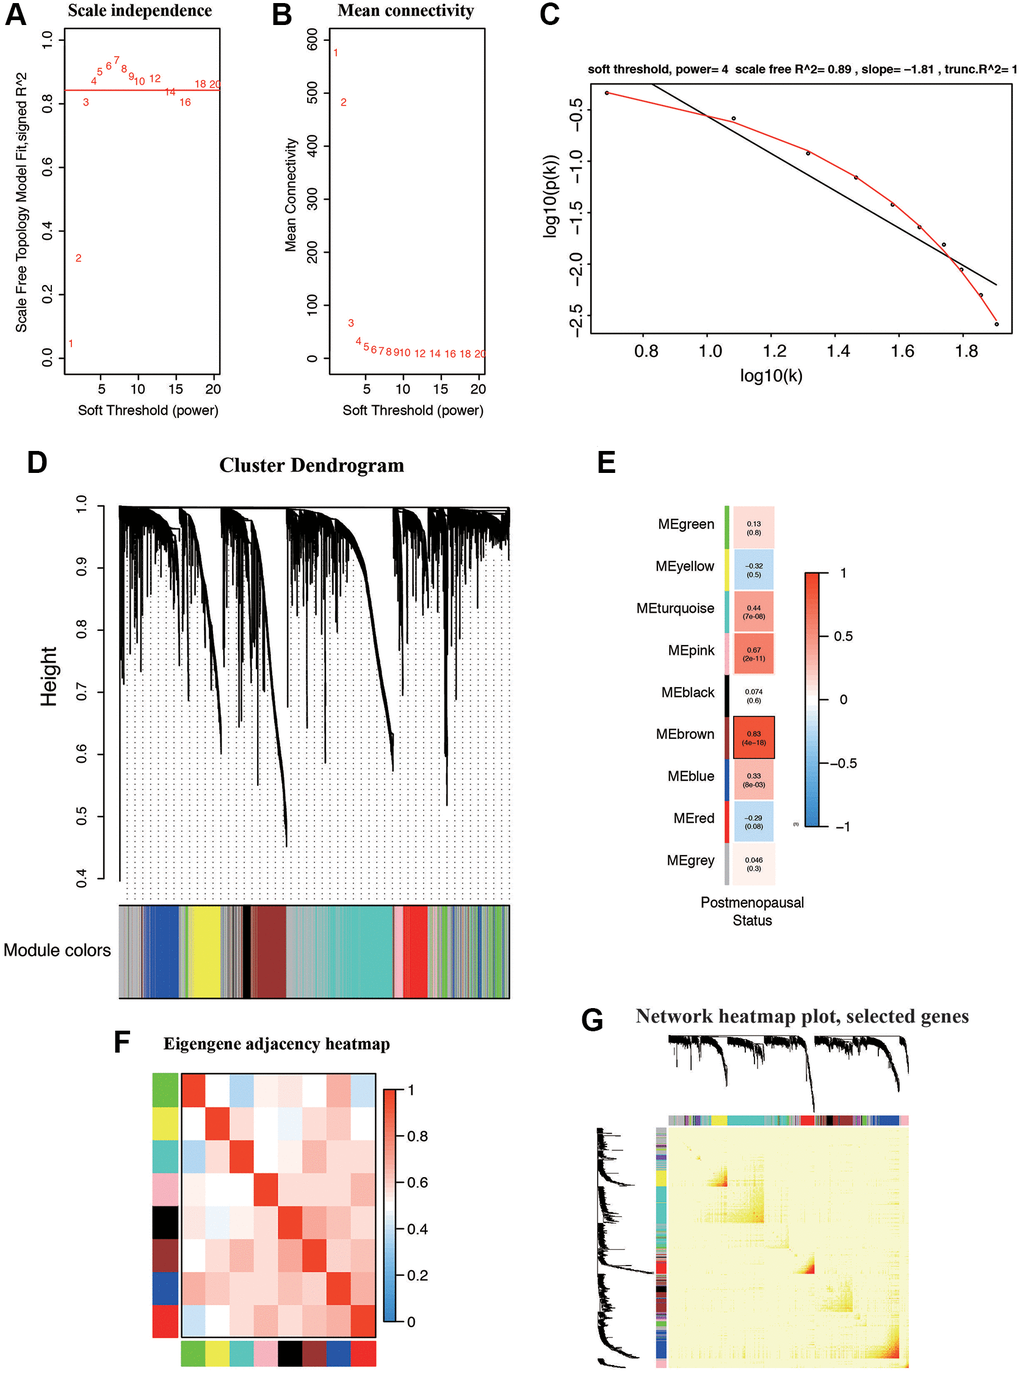
Figure 3.Weighted gene correlation network (WGCNA) on the RNA-seq database and selection of hub genes. (A, B) Screening and validation of the soft threshold. (C) Checking the scale free topology when β = 4. The x-axis demonstrates the logarithm of whole network connectivity, while the y-axis shows the logarithm of the corresponding frequency distribution. (D) Clustering dendrogram of common DEGs in EC tissues. (E) Correlation between modules and postmenopausal status. (F) Correlations between different modules. (G) Heatmap depicts the Topological Overlap Matrix (TOM) of genes selected for WGCNA. Light color represents lower overlap and deep color represents higher overlap.