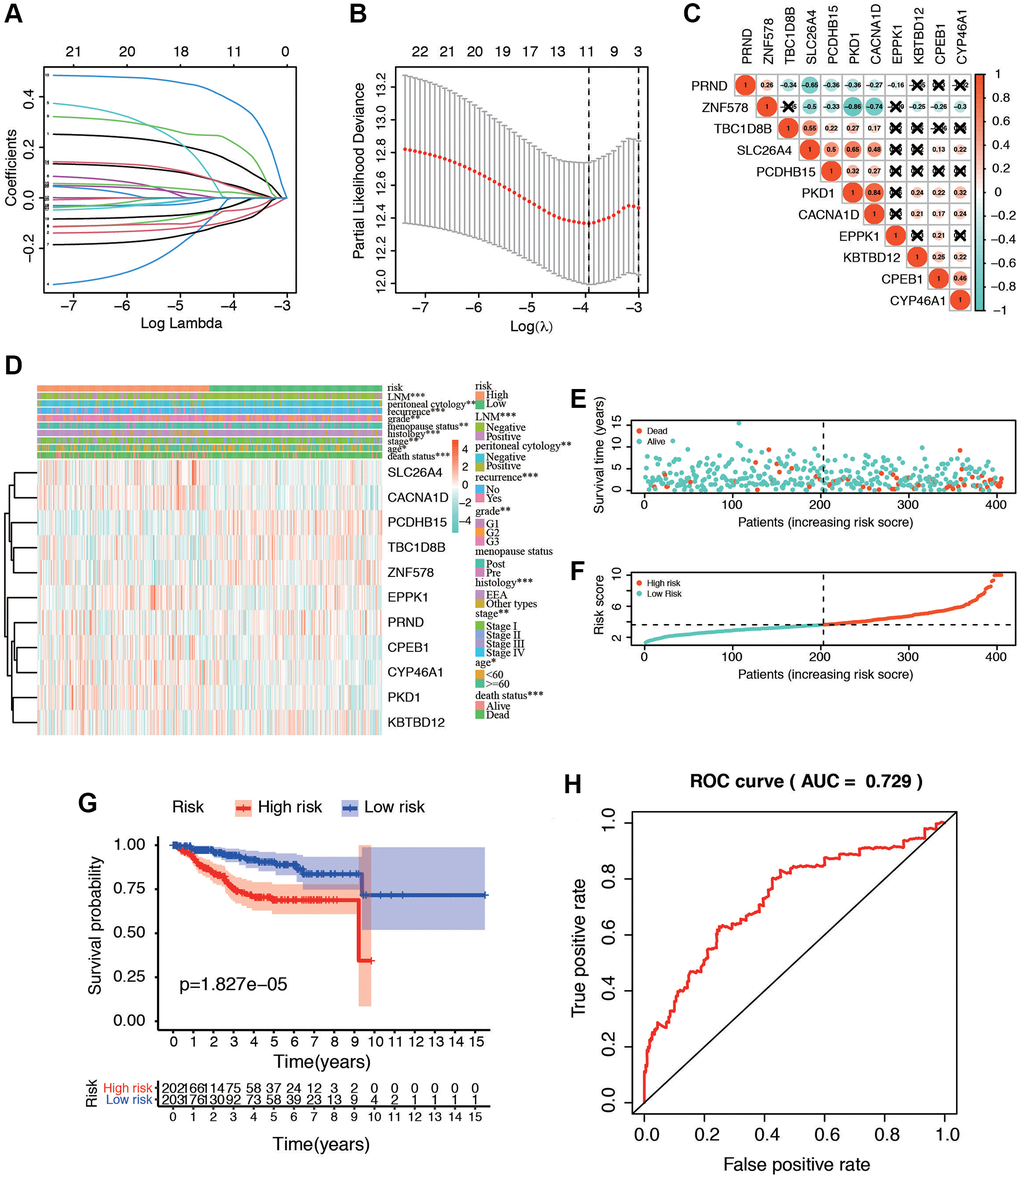
Figure 5.Identification of postmenopausal related prognostic signature in EC patients. (A) Plots of the ten-fold cross-validation error rates. (B) LASSO coefficient profiles of the eleven postmenopausal related genes. (C) Spearman correlation analysis with the selected 11 genes. (D) Heatmap and clinicopathological features of high- and low-risk groups. The samples are ordered by risk score, and the score decreases from left to right. (E, F) Risk score distribution in low- and high-risk groups. (G) Kaplan-Meier survival analysis of the low and high-risk group. (H) Time-dependent ROC curves for overall survival prediction for EC patients.