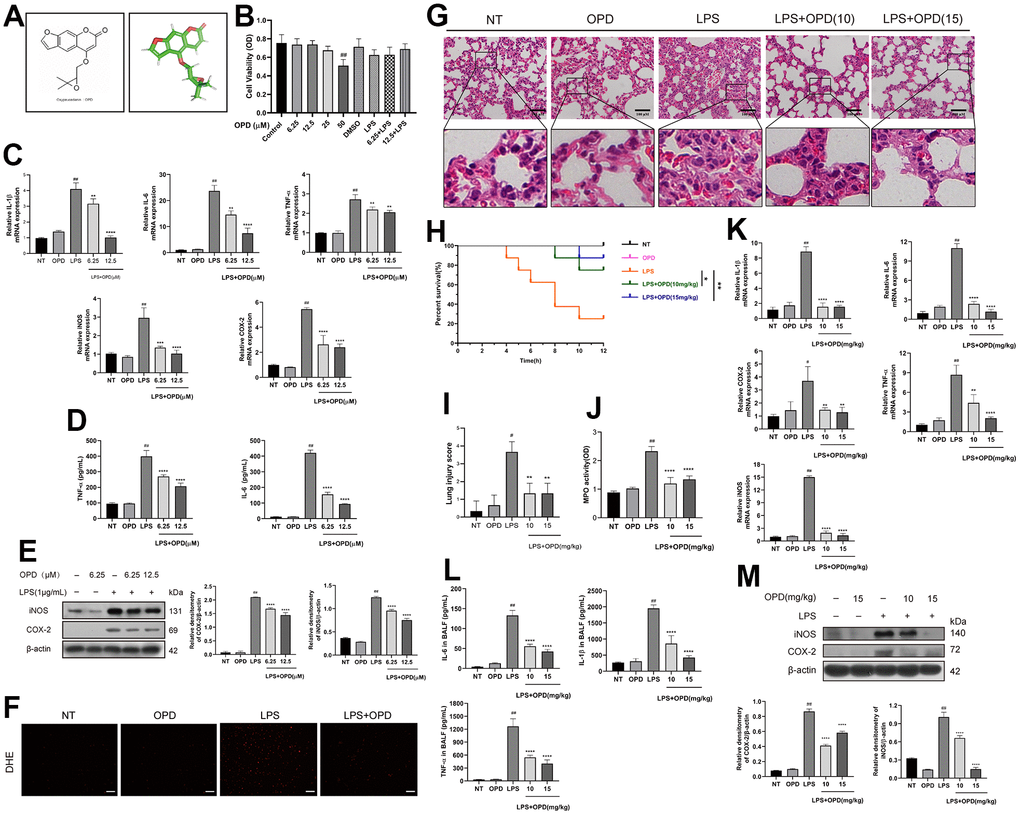
Figure 1.Oxypeucedanin attenuated changes in inflammation levels in the lung tissue of LPS-induced mice and LPS-induced RAW264.7 cells. (A) The molecular structure of OPD and the three-dimensional structure of the OPD molecule. (B) RAW264.7 cells were cultured in a 37° C cell incubator with 5% CO2. The cells were pretreated with OPD for 1 h, then with or without LPS (1 ug/ml) for 24 h. Different concentrations of OPD were dissolved in DMSO, and the content of DMSO was 0.1%. The effect of OPD on the viability of RAW264.7 cells was determined by the CCK8 assay. (C) After the OPD pretreatment for 1 h, RAW264.7 cells were stimulated with LPS (1 μg/mL) for 6 h, and total RNA was extracted by TRIzol. The mRNA transcription levels of IL-6, IL-1β, TNF-α, iNOS, and COX-2 were determined by qRT–PCR. (D) RAW264.7 cells were stimulated with LPS for 12 h, the culture medium was collected, and the supernatant was collected after centrifugation. IL-6 and TNF-α protein expression levels were determined by ELISA. (E) After 1 h of the OPD (6.25 and 12.5 μM) pretreatment, RAW264.7 cells were stimulated with LPS (1 μg/mL) for 12 h. The protein expression levels of iNOS and COX-2 were determined by Western blotting. The protein bands of iNOS and COX-2 in RAW264.7 cells are shown. The quantitative analysis of iNOS and COX-2 protein was visualized by ImageJ. (F) The fluorescence intensity of ROS levels was read by a fluorescence microscope; scale bar = 50 μm. (G) H&E staining of the lung tissue. The collected lung tissue was processed into paraffin tissue cuts and then soaked in hematoxylin and eosin in sequence, and finally, H&E staining results were obtained, scale bar = 100 μm (H&E: magnification: 200×). (H) After the LPS induction or equivalent volumes of saline and OPD pretreatment, the survival of mice was observed within 12 h (n=8). (I) The lung pathological injury score was determined as follows. Four pathological sections of H&E staining were randomly selected from each group for lung injury scoring with a 200× microscope field of view. (J) MPO of the lung tissue. The supernatant of fresh lung tissue was used as an MPO sample after homogenization (n=5). (K) The mRNA levels of inflammatory factors (IL-6, IL-1β, TNF-α, iNOS, and COX-2) in lung tissue (n=5). (L) The levels of IL-6, IL-1β, and TNF-α in the BALF of LPS-treated mice (n=5). (M) Protein levels of iNOS and COX-2 in LPS-induced mice (n=3). The quantitative analysis of iNOS and COX-2 proteins was performed by ImageJ. The concentrations of OPD in cell and animal experiments were 12.5μM and 15mg/kg, respectively. SEM was used as the error standard for data analysis, and the experiment was repeated three times independently. #p < 0.01, ##p < 0.0001 compared with No-treatment group; **p < 0.01, ***p < 0.001 and ****p < 0.0001 compared with the LPS group. LPS: Lipopolysaccharide; OPD: Oxypeucedanin; NT: No-treatment group. MPO: Myeloperoxidase LPS: Lipopolysaccharide; BALF: Bronchoalveolar Fluid.