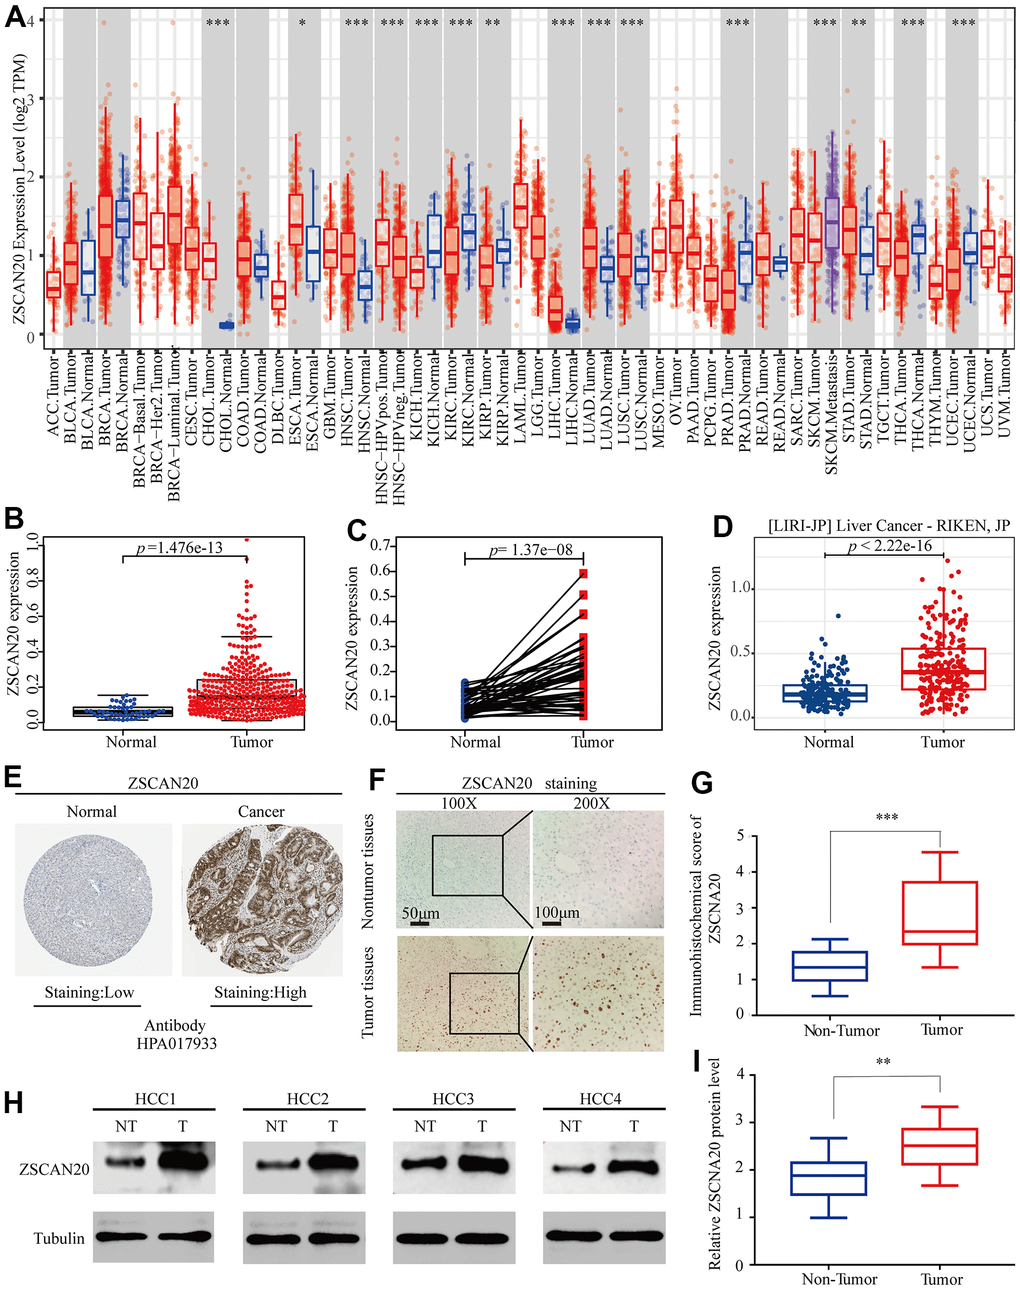
Figure 1.Expression of ZSCAN20 in HCC. (A) The expression level of ZSCAN20 in different types of tumor tissues and normal tissues in the TIMER database (P < 0.05). (B) Expression levels of ZSCAN20 were higher than corresponding normal tissues in LIHC samples (TCGA-LIHC) (p=1.476e-13). (C) ZSCAN20 expression in 50 paired LIHC tissues and corresponding adjacent non-tumor tissues (TCGA-LIHC) (p=1.37e-08). (D) Expression levels of ZSCAN20 were higher than corresponding normal tissues in LIHC samples by using ICGC-LIRI-JP liver datasets. (E) ZSCAN20 protein expression in normal and LIHC tissues (HPA). (F) Typical images of immunohistochemistry (IHC) in 35 pairs of LIHC tissues showing the protein expression of ZSCAN20 in LIHC and adjacent non-tumor tissues. (G) Diagram of ZSCAN20 staining score in IHC staining. (H) The protein expression of ZSCAN20 in tumor tissues and adjacent normal tissues was detected by Western Blot, and the coloring depth represented the level of protein expression. (I) Quantification of ZSCAN20 protein expression based on western blot.