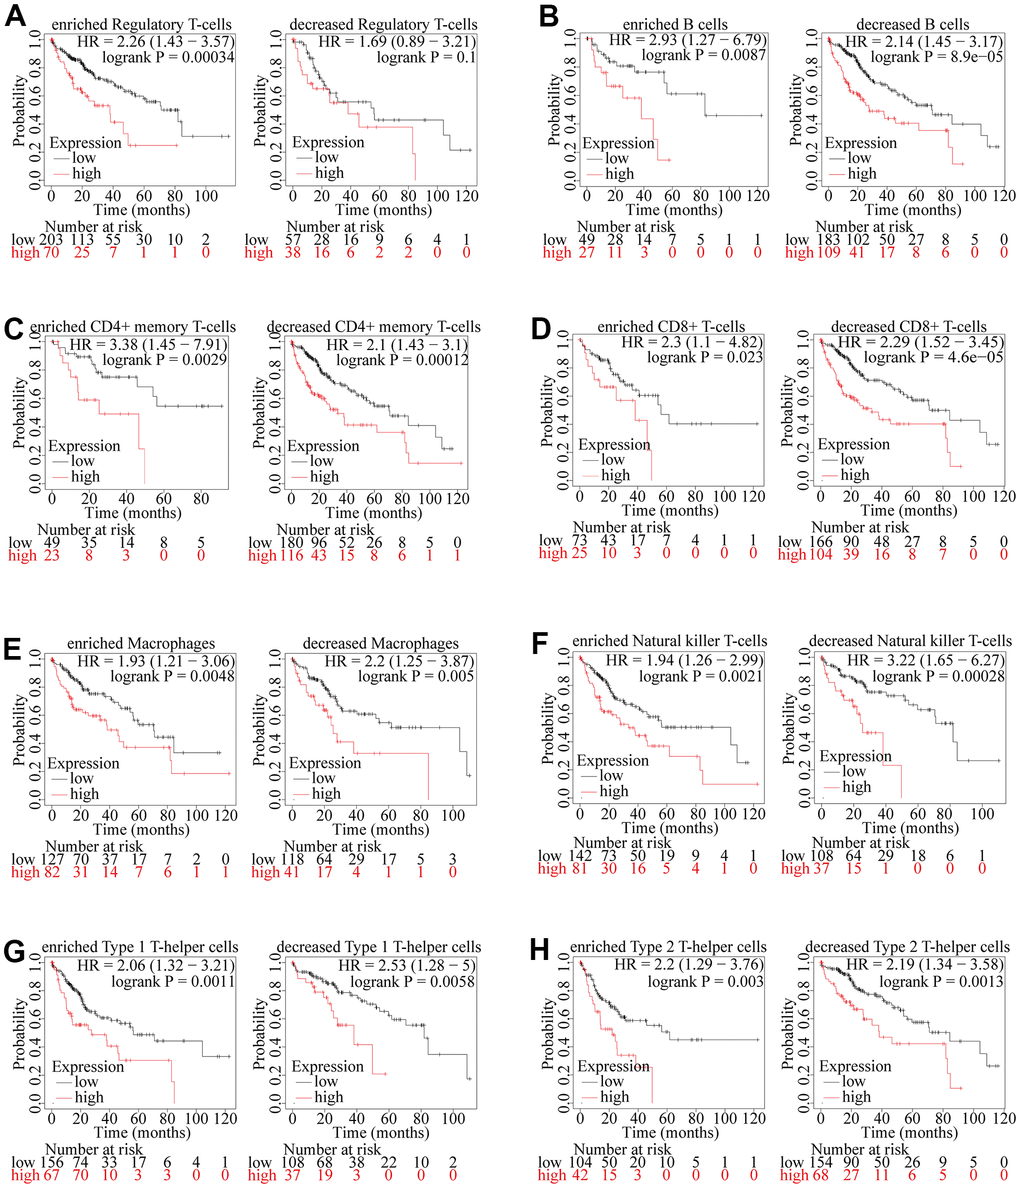
Figure 11.Kaplan-Meier survival curves according to high and low expression of ZSCAN20 in immune cell subgroups in HCC. (A–H) Correlations between ZSCAN20 expression and OS in different immune cell subgroups in HCC patients were estimated by Kaplan-Meier plotter.