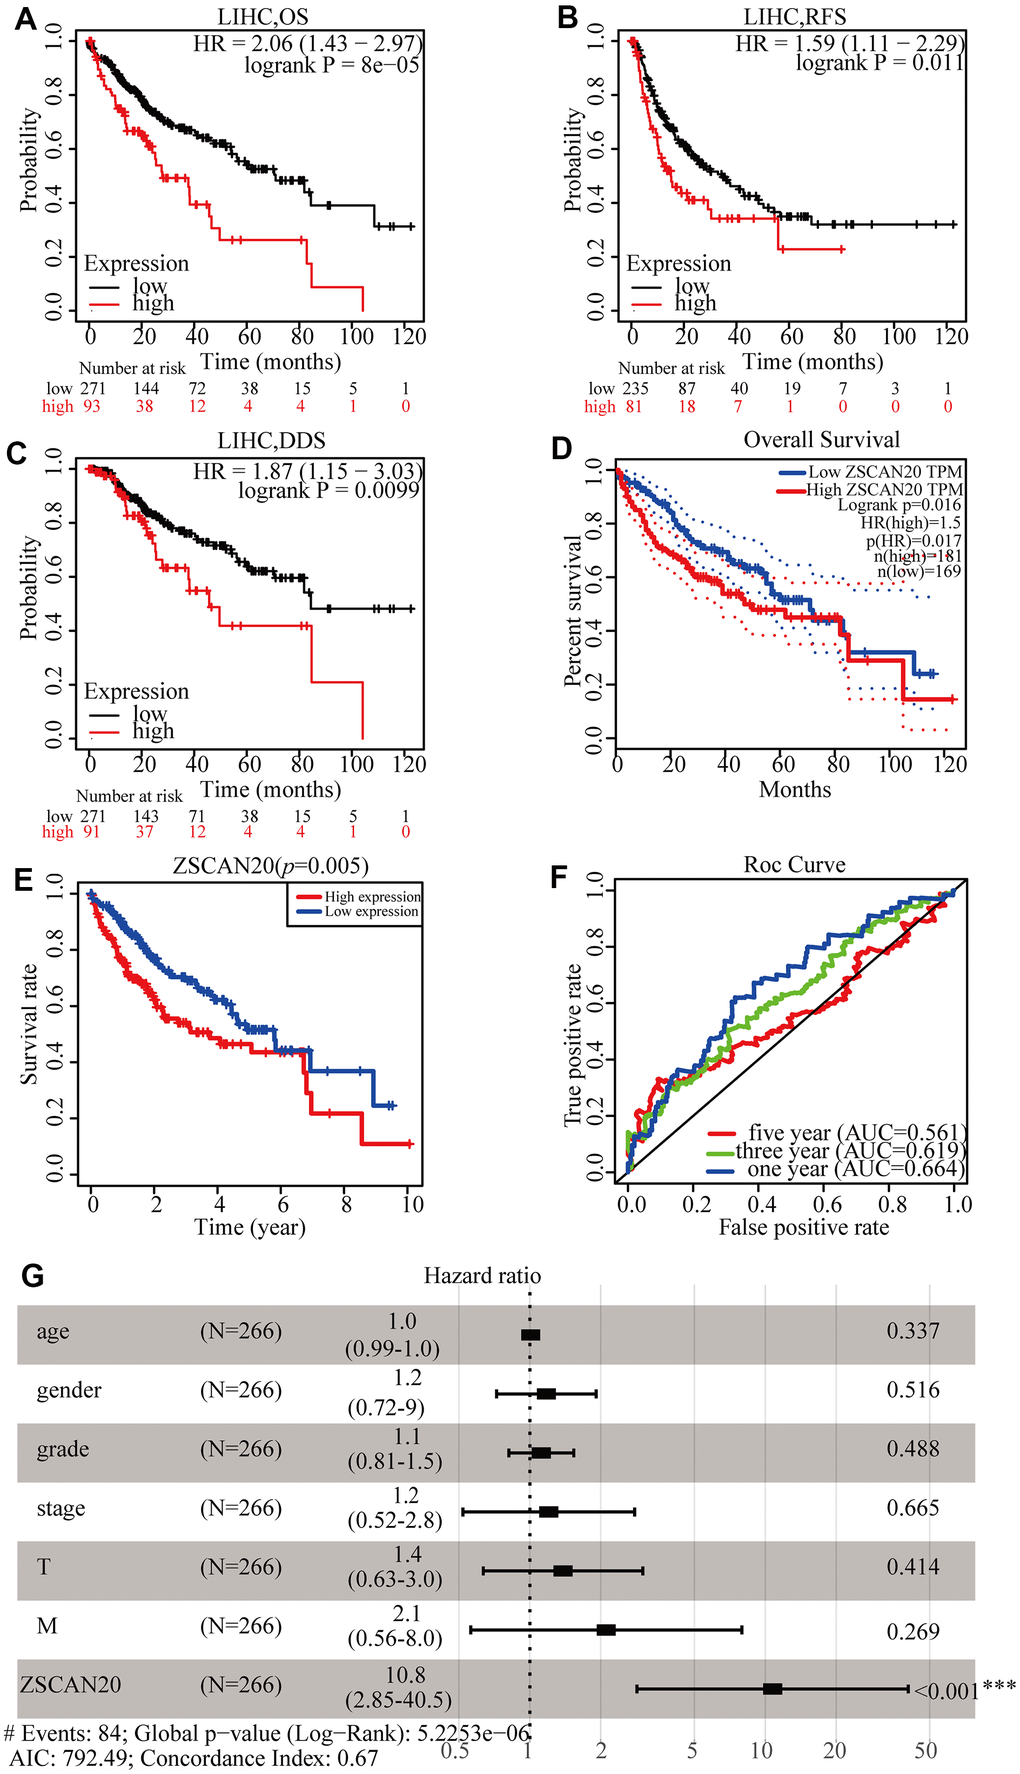
Figure 3.ZSCAN20 expression was associated with poor survival in HCC patients. (A–C) Survival curves using the Kaplan-Meier plotter are shown for OS, RFS, and DSS. (D) Survival curves using GEPIA is shown for OS. (E) Associations with overall survival and the expression of ZSCAN20 in TCGA patients. (F) ROC, receiver operating characteristic; ROC curve sensitivity and specificity analysis of LIHC, AUC, area under the curve. (G) A forest plot showed the correlation between ZSCAN20 expression and clinicopathological parameters in LIHC patients. *P < 0.05; **P < 0.01; ***P < 0.001. HR, hazard ratio; CI, confidence interval; T, tumor; N, node, M, metastasis; OS, overall survival; AIC, Akaike information criterion.