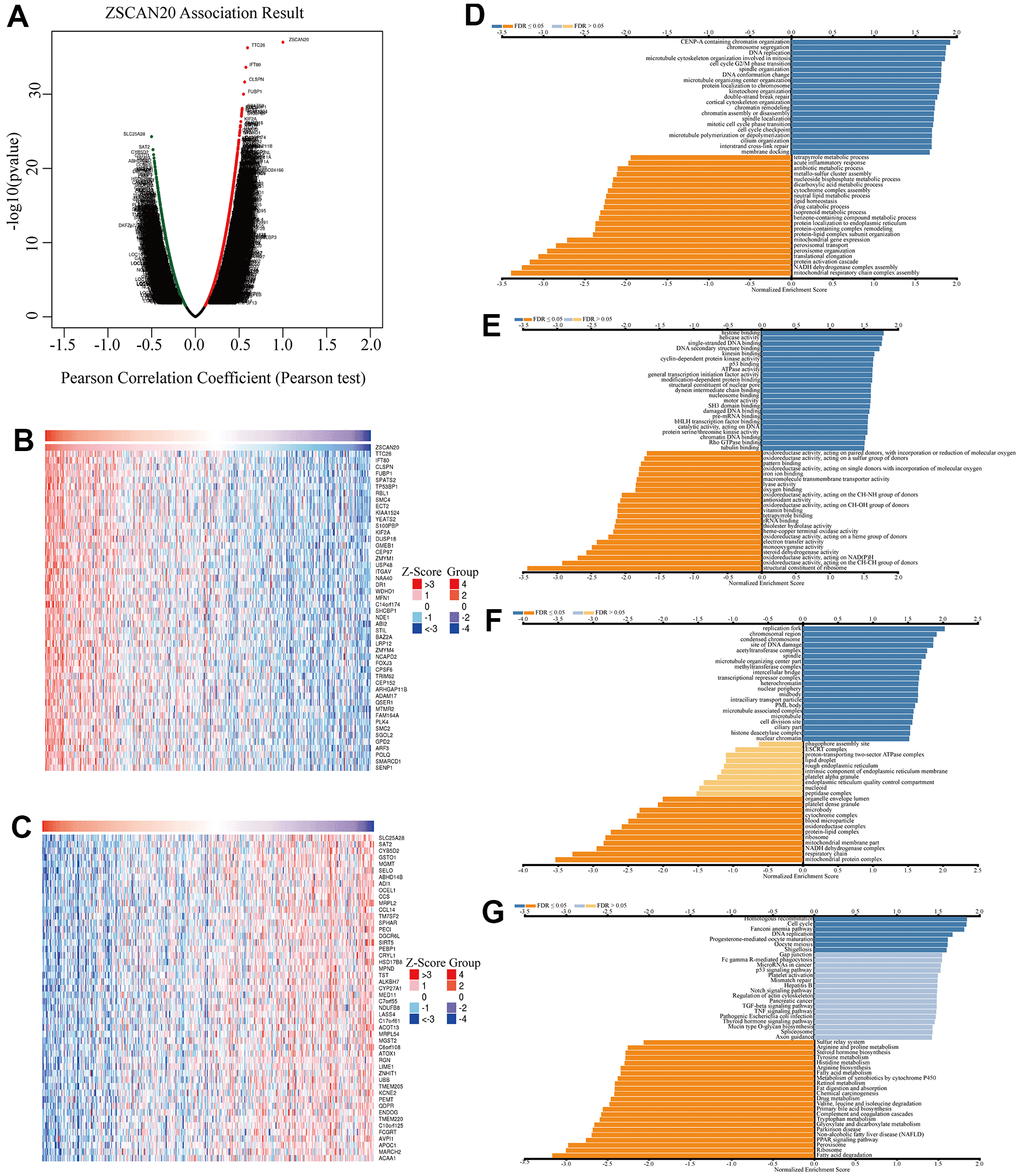
Figure 5.Co-expression genes of ZSCAN20 in HCC. (A) Volcano plot of genes highly correlated with ZSCAN20 identified by the Pearson test in LIHC. Red and green dots represent genes significantly positively and negatively correlated with ZSCAN20, respectively. Heatmaps of the top 50 genes (B) positively and (C) negatively correlated with ZSCAN20. (D–G) Significantly enriched GO and KEGG pathways of ZSCAN20. GO: Gene Ontology; KEGG: Kyoto Encyclopedia of Genes and Genomes.