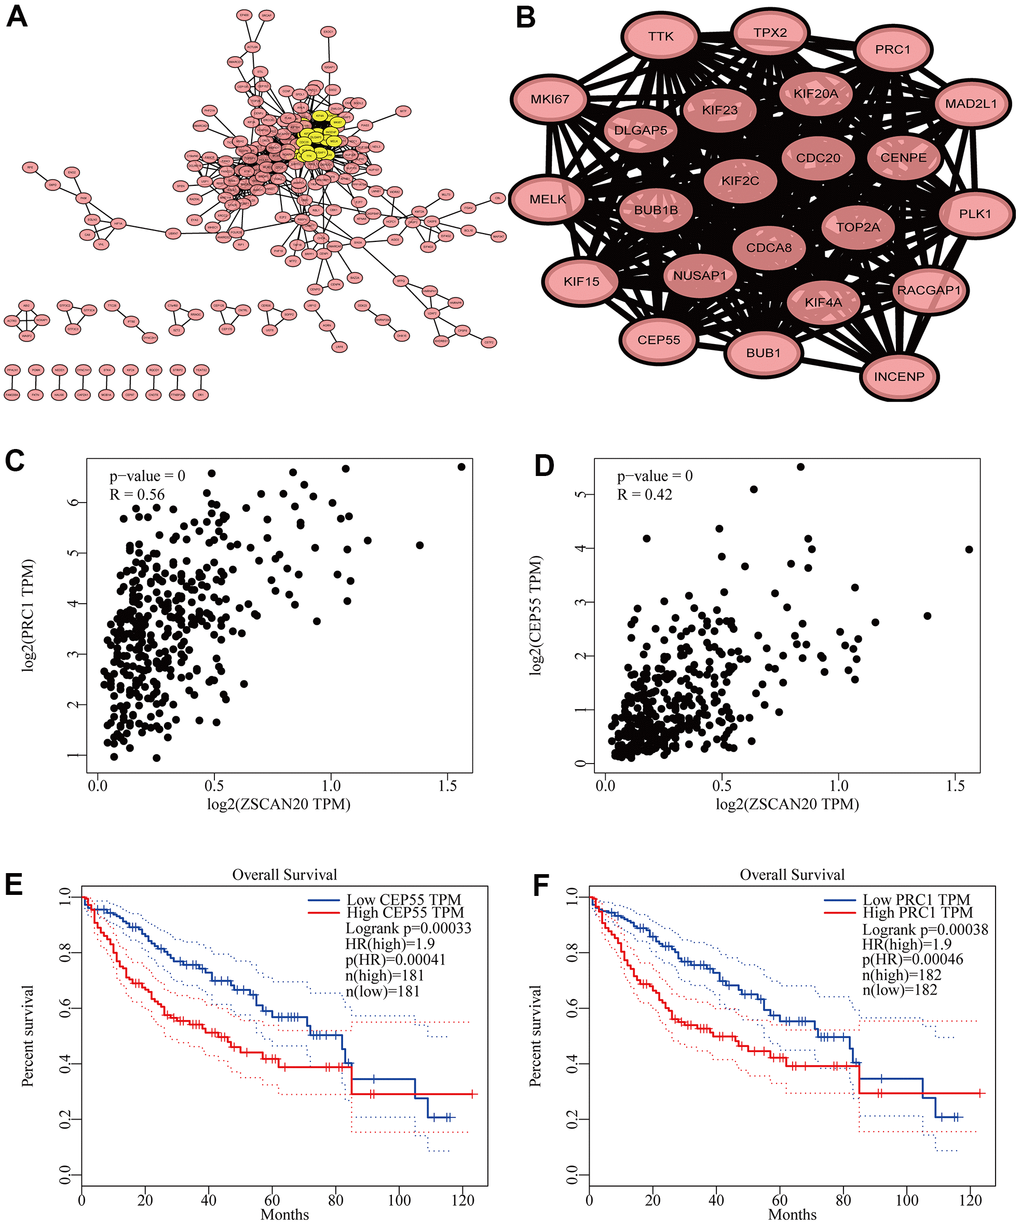
Figure 7.Cell cycle related genes correlation analysis. (A) Top 500 genes in LinkedOmics were filtered into protein–protein interaction network complex. (B) The PPI network of ZSCAN20 was generated using STRING. (C, D) Draw a scatter plot to show the correlation between the ZSCAN20 and the highest score genes (PRC1 and CEP55). (E, F) Associations with overall survival and the expression of PRC1 and CEP55.