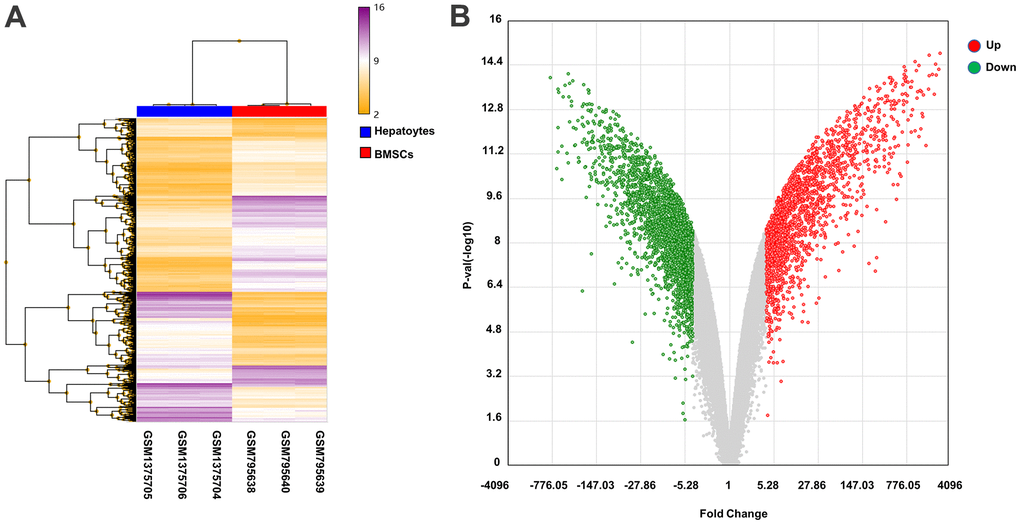
Figure 3.Heat map and volcano plot analysis of DEGs. (A) Heat map of DEGs. The abscissa shows the clustering of samples: GSM795638, GSM795639, and GSM795640 are BMSCs samples, and GSM1375704, GSM1375705, and GSM1375706 are hepatocyte samples. The right vertical axis indicates the clustering of genes in the two samples. The main body of the heat map contains genes, with purple and yellow lines denoting upregulated and downregulated genes, respectively. (B) Volcano plot of DEGs. The red and green dots represent upregulated and downregulated genes, respectively, in hepatocytes samples.