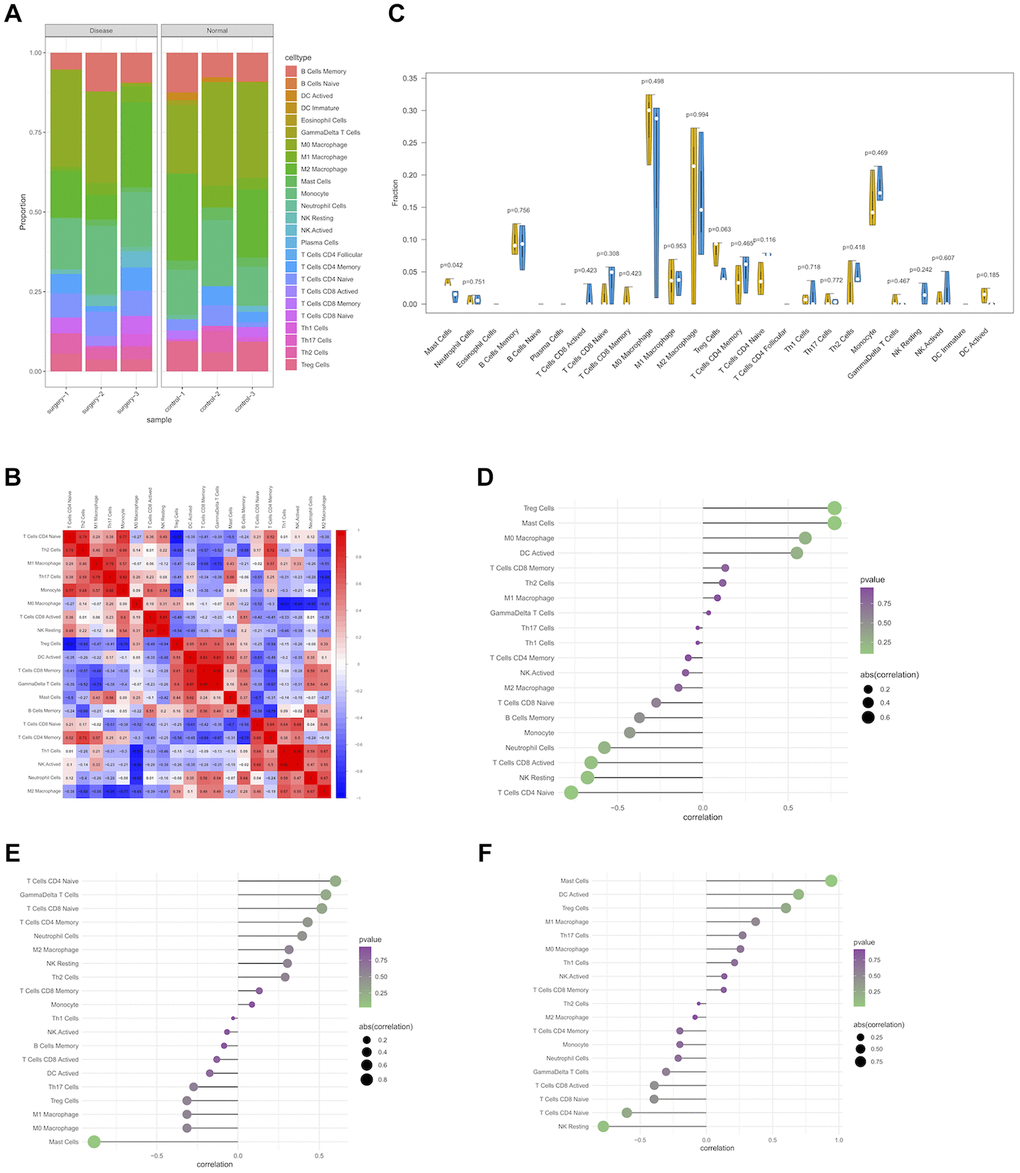
Figure 5.Immune infiltration of PND group and control group in experimental data. (A) Boxplot of the relative percentage of different types of immune cells in PND and non-PND mice. (B) The heat map shows the correlation of CIBERSORT infiltrating innate immune cells, with blue indicating negative correlation and red indicating positive correlation. (C) Differences in immune infiltration between PND group (blue) and control group (yellow). (P < 0.05 was considered statistically significant). Correlation between expression levels of hub genes and immune cell content using Spearman's correlation. The size of the dot indicates the level of correlation, and the color depth indicates the size of P-value. (D) The correlation between Unc13C expression and immune cell content (E), the correlation between Tbx20 expression and immune cell content (F), and the correlation between St8sia2 expression and immune cell content.