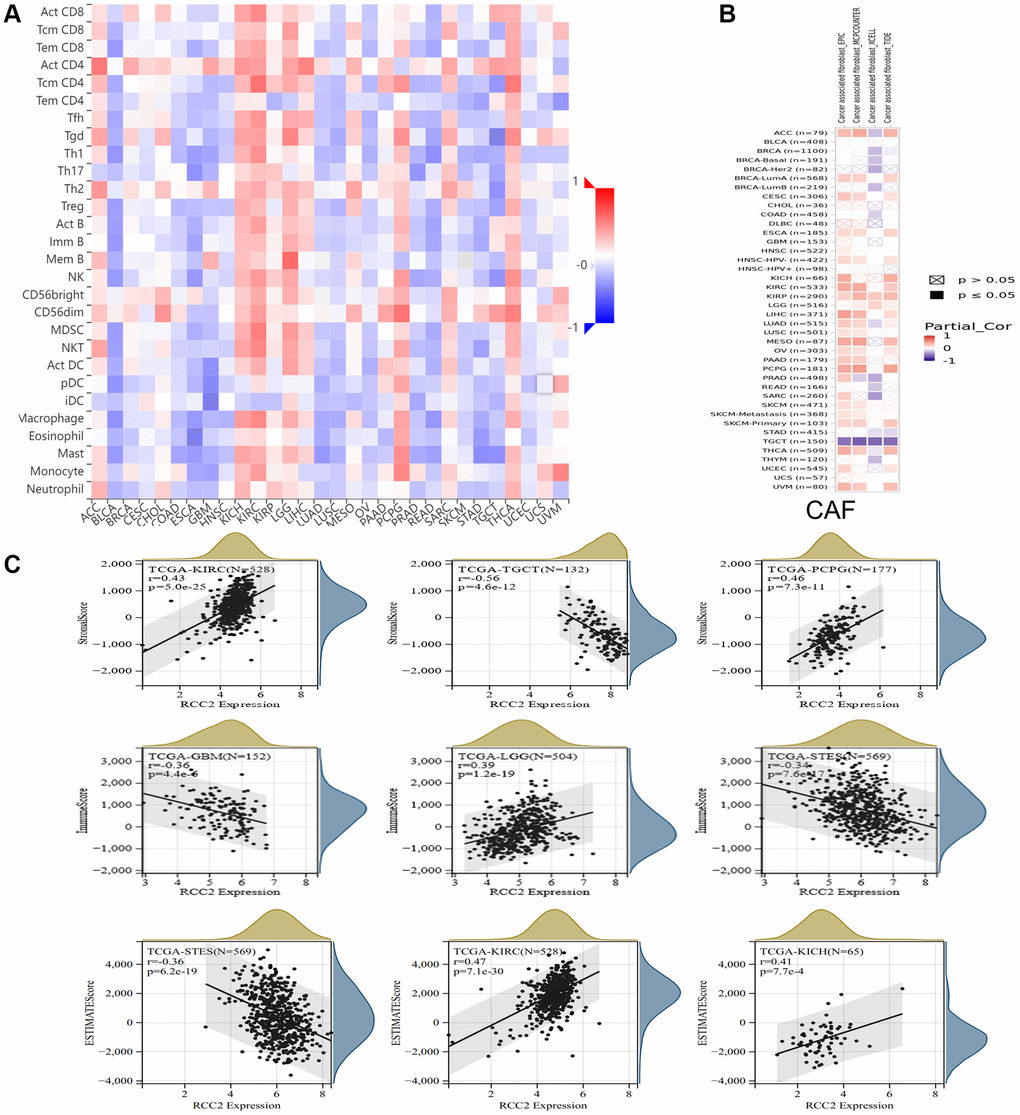
Figure 7.Relationship between RCC2 expression and immune microenvironment. (A) The correlation heat map shows the relationship between RCC2 expression and immune infiltrating cells. Red color represents positive correlation, and blue color represents negative correlation. (B) The relationship between RCC2 expression and CAFs. (C) The top three cancer types with the most significant correlation between the degree of immune infiltration and RCC2 expression were displayed.