


Introduction
Regulator of Chromosome Condensation 2 (RCC2, as known as TD60) is located at the 1p36 site and is a highly conserved member of the guanine nucleotide exchange factor (GEF) RCC1 family [1]. The RCC2 gene, as a component of the chromosomal passenger complex (CPC), plays a vital role in regulating mitotic and cytoplasmic divisions during the cell cycle [2]. It has also been shown that RCC2 is a coordinating gene of the fibronectin-dependent adhesion signaling pathway and has a regulatory role in the maintenance of directional cell migration and cell spreading [3].
Recently, several studies have shown that the RCC2 is participated in the pathophysiological processes of cancers in different ways. RCC2 expression was shown to be elevated in breast cancer tissues and was related to an inferior prognosis in breast cancer patients, according to research by Chen et al. [4]. Elevated RCC2 expression is closely linked to the advanced tumor metastasis and unfavorable prognosis in lung adenocarcinoma [5]. In hepatocellular carcinoma, increased expression of RCC2 promoted HCC cell invasion and chemoresistance to cisplatin [6]. Furthermore, elevated RCC2 was associated with an inferior prognosis in glioma patients and increased radioresistance in glioblastoma tumor cells through the activation of DNMT1 transcription [7]. In esophageal cancer, it has also been discovered that RCC2 accelerates cancer growth and invasion by boosting proliferation, transformation, and migration by inhibiting SOX2 ubiquitination-mediated proteasomal degradation [8]. Although RCC2 is currently considered as a potential biomarker in several malignancies, its clinical implications across different tumors remain unclear.
Despite the current proliferation of tumor-related treatment strategies available, there are still a large number of patients with advanced cancer who have limited options for treatment modalities. Immunotherapy is a treatment approach that overcomes the immune escape pathway by modulating the body’s immune system to activate the anti-tumor immune response. Currently, the combination of immunotherapy, surgery, chemotherapy, and radiotherapy is becoming the new treatment modality being explored in the immunotherapy era. The tumor microenvironment (TME) is one of the factors affecting the success of immunotherapy, so it is crucial to understand the targets related to tumor immunotherapy.
Currently, RCC2 has only been reported in some specific tumors, and there is still no clear evidence of its regulatory role and molecular mechanism in pan-cancer. Meanwhile, poorly is understood the immunomodulatory function of RCC2 in the immune microenvironment. In the current research, we comprehensively profiled the expression and function of the RCC2 gene in pan-cancer through the public database, including TIMER, GEPIA2, UALCAN, cBioPortal, Kaplan-Meier plotter and TISIDB etc. We further evaluated the connection between RCC2 gene expression and immune microenvironment across various tumor types. We found that RCC2 was significantly overexpressed in the majority of tumors and may contribute to the development of cancers. Besides, the expression level of RCC2 in pan-cancer was significantly associated with the cancer immune microenvironment. These findings highlight the significant role of RCC2 in diverse cancers and provide an alternative therapeutic target for clinical utility.
Results
RCC2 expression levels across various cancer and normal tissues
Firstly, we applied the TIMER2.0 website to evaluate the RCC2 expression in pan-cancer. We revealed that RCC2 was significantly overexpressed in the majority of tumor tissues, including breast invasive carcinoma (BRCA), cervical squamous cell carcinoma and endocervical adenocarcinoma (CESC), liver hepatocellular carcinoma (LIHC), esophageal carcinoma (ESCA), glioblastoma multiforme (GBM), NSC-HPV+, NSC-HPV−, bladder Urothelial Carcinoma (BLCA), head and neck squamous cell carcinoma (HNSC), kidney renal papillary cell carcinoma (KIRP), lung adenocarcinoma (LUAD), colon adenocarcinoma (COAD), kidney renal clear cell carcinoma (KIRC), prostate adenocarcinoma (PRAD), stomach adenocarcinoma (STAD), thyroid carcinoma (THCA), lung squamous cell carcinoma (LUSC), cholangiocarcinoma (CHOL), rectum adenocarcinoma (READ), uterine corpus endometrial carcinoma (UCEC). In contrast, only kidney chromophobe (KICH) demonstrated lower RCC2 expression in tumor tissues (p < 0.05) (Figure 1A).
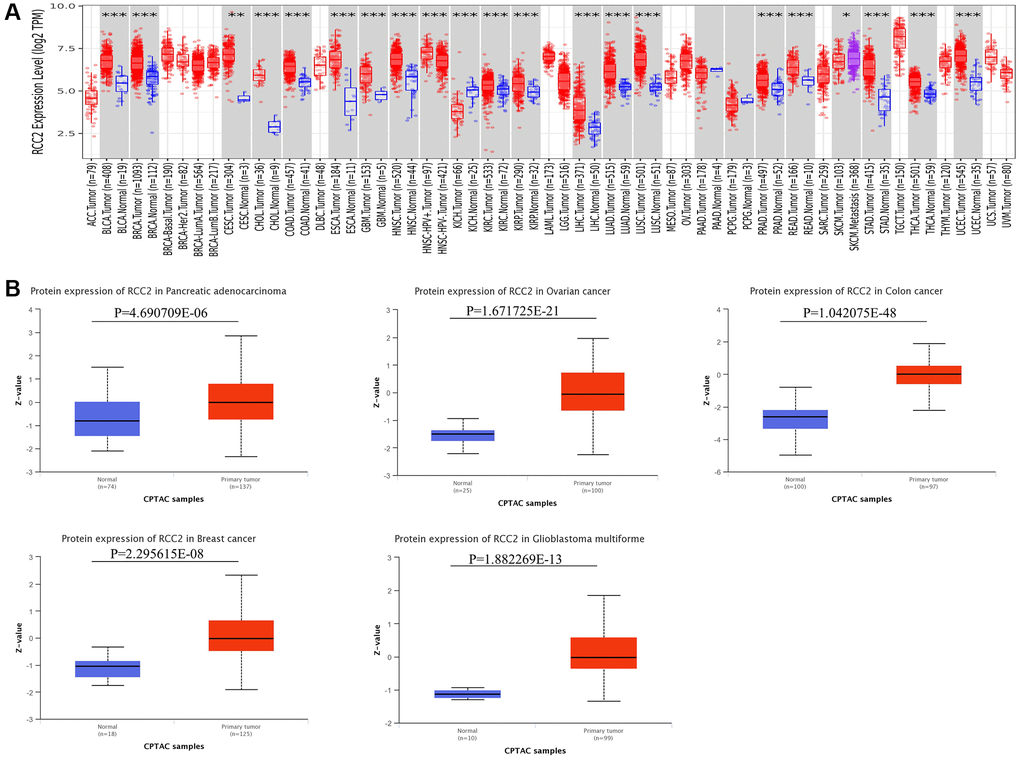
Figure 1. RCC2 mRNA and protein expression in tumor and normal tissues. (A) Expression levels of RCC2 gene in tumor and normal tissues based on TIMER2.0 database. (B) The protein level of RCC2 between normal and different tumor tissues. *p < 0.05; **p < 0.01; ***p < 0.001.
In addition to mRNA levels, we further analyzed RCC2 at a protein level using the CPTAC dataset. The total protein expression of RCC2 was considerably elevated in pancreatic adenocarcinoma (PAAD), COAD, ovarian serous cystadenocarcinoma (OV), GBM and BRCA tumors compared to normal tissues (Figure 1B). We further validated the expression of RCC2 from proteomics data of 16 different cancer types [9]. We observed that RCC2 was overexpressed in BLCA, COAD, LUAD, LUSQ, LUSC, KIRC, PRAD, and STAD (Supplementary Figure 1). Besides, we also found that RCC2 protein was abnormally expressed in many cancer types from the HPA database. Figure 2 illustrated the immunohistochemistry findings regarding the expression level of RCC2 protein.
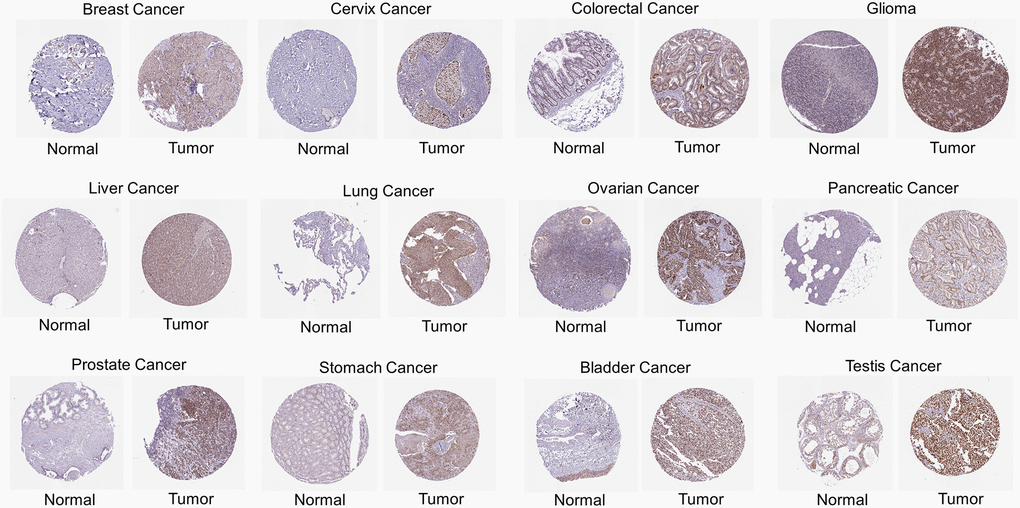
Figure 2. Immunohistochemical images of protein expression of RCC2 in various cancer types.
RCC2 expression with clinicopathological characteristics
To investigate the relationship between the mRNA expression of RCC2 and clinicopathological features in pan-cancer. We utilized the GSCALite for the exploration of RCC2 expression and the clinicopathological stage. The pathologic stage classified samples into Stage I to IV. The result revealed that RCC2 expression has stage-specific expression changes in HNSC, KIRP, adrenocortical carcinoma (ACC), KIRC, and THCA (Supplementary Figure 2). The trend plot also demonstrated that the expression of RCC2 in ESCA, KIRC, KIRP, HNSC, THCA, and READ gradually increased with increasing staging. However, RCC2 mRNA expression in COAD, LUSC, STAD, and uveal melanoma (UVM) was negatively correlated with the stage (Figure 3).
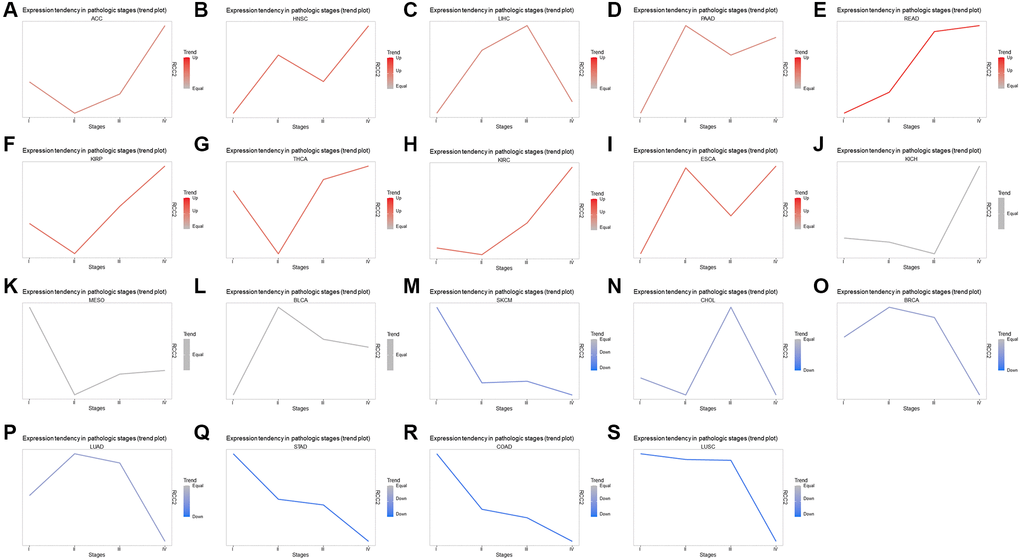
Figure 3. Correlation with RCC2 expression and clinicopathology. (A–S) Trend plots summarize the RCC2 mRNA expression trends from early to late stages in various tumor types.
We then investigated the association between RCC2 expression and molecular subtypes throughout pan-cancer using TISIDB’s “subtype” module. The findings presented that the molecular subtype of brain lower-grade glioma (LGG), GBM, ACC, BRCA, COAD, ESCA, KIRP, PCPG, PRAD, OV, HNSC, LUSC, STAD, LIHC, and UCEC were all strongly correlated with RCC2 expression (Figure 4).
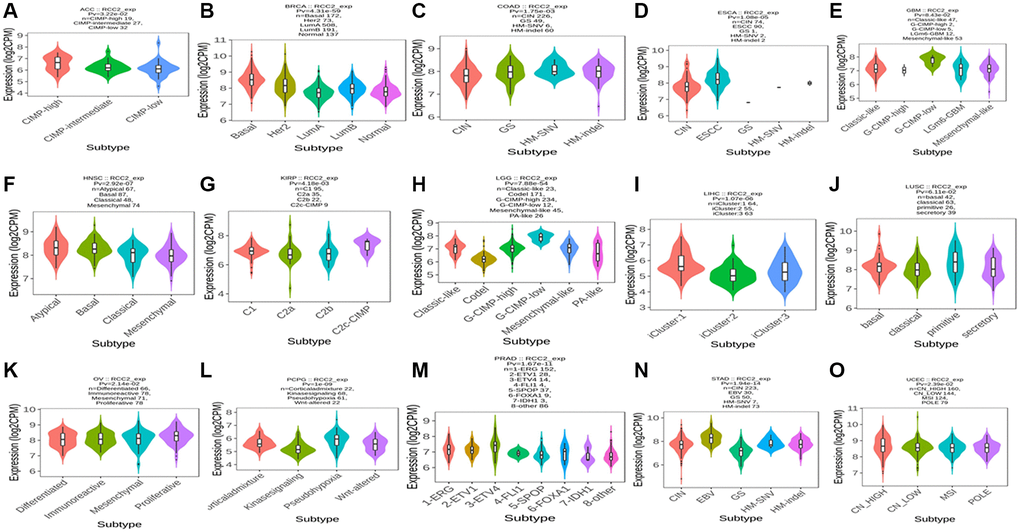
Figure 4. (A–O) The relationship between RCC2 expression and various tumor molecular subtypes.
Analysis of RCC2 expression and survival in various cancer types
Since the RCC2 was overexpressed in numerous malignancies and was related to the tumor stage, we further explored its prognostic value in pan-cancers. The correlation between RCC2 expression and survival endpoints such as OS and RFS was further analyzed using a KM plotter. We revealed that the elevated expression of RCC2 was considerably related to an unfavorable prognosis in KIRC (HR:2.06, 95% CI:1.52–2.78, log-rank p = 1.5e-06), KIRP (HR:1.85, 95% CI:1.03–3.35, p = 0.038), LIHC (HR:2.23, 95% CI:1.53–3.25, p = 1.7e-05), LUAD (HR:1.53, 95% CI:1.14–2.04, p = 0.0043), PAAD (HR:1.7, 95% CI:1.11–2.59, p = 0.014), sarcoma (SARC) (HR:2.14, 95% CI:1.4–3.28, p = 0.00033); whereas, the high expression of RCC2 was associated with a favorable prognosis in thymoma (THYM) (HR:0.27, 95% CI:0.07–1.02, p = 0.039), STAD (HR:0.68, 95% CI:0.49–0.95, p = 0.021), CESC (HR:0.43, 95% CI:0.27–0.69, p = 0.00033), ESCA (HR:0.35, 95% CI:0.14–0.87, p = 0.019), BRCA (HR:0.66, 95% CI:0.47–0.93, p = 0.016) (Figure 5). Furthermore, the high expression of RCC2 was found to result in a shorter RFS in patients with KIRP, LIHC and PAAD (Supplementary Figure 3).
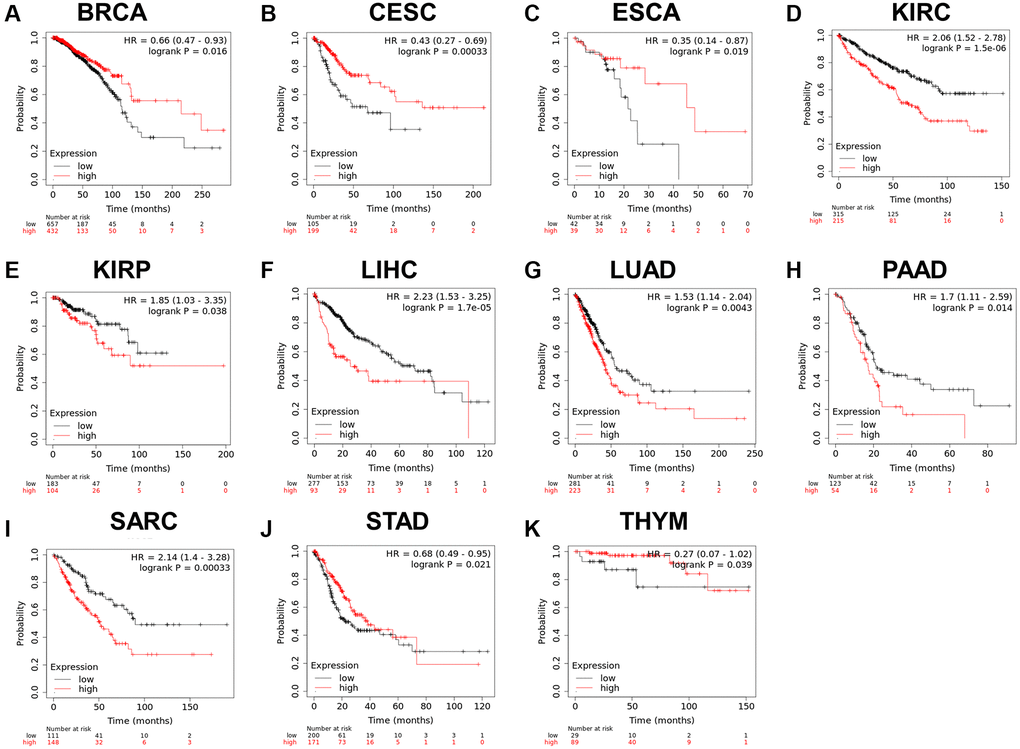
Figure 5. (A–K) Relationship between RCC2 expression and overall survival analysis data in TCGA pan-cancer. Only tumor types with log-rank p < 0.05 were displayed.
Genetic alterations of RCC2 in pan-cancers
We then examined the genetic alterations of RCC2 in pan-cancers by using the cBioPortal database. Our results demonstrated that the highest frequency type of RCC2 alteration occurs in Cholangiocarcinoma, with “deep deletion” as the predominant type (>5%) (Figure 6A). Deep deletion was the only altered type in Cholangiocarcinoma (5.56%), Pheochromocytoma and Paraganglioma (2.25%), Mesothelioma (MESO) (1.15%), and Testicular Germ Cell Tumors (0.67%) (Figure 6B). Furthermore, we identified 101 mutation sites between amino acids 0 and 522, including 81 missense, 15 truncating, 2 in-frame, 2 splices, and 1 fusion mutation (Figure 6C). The genetic alterations in OR8U8, OR5AK4P, FAM111A-DT, OR7E5P, SEPTIN7P11, LINC02735, TRIM51HP, TTN, ARHGEF10L, and SPEN were more prevalent than in the altered group (Figure 6D).
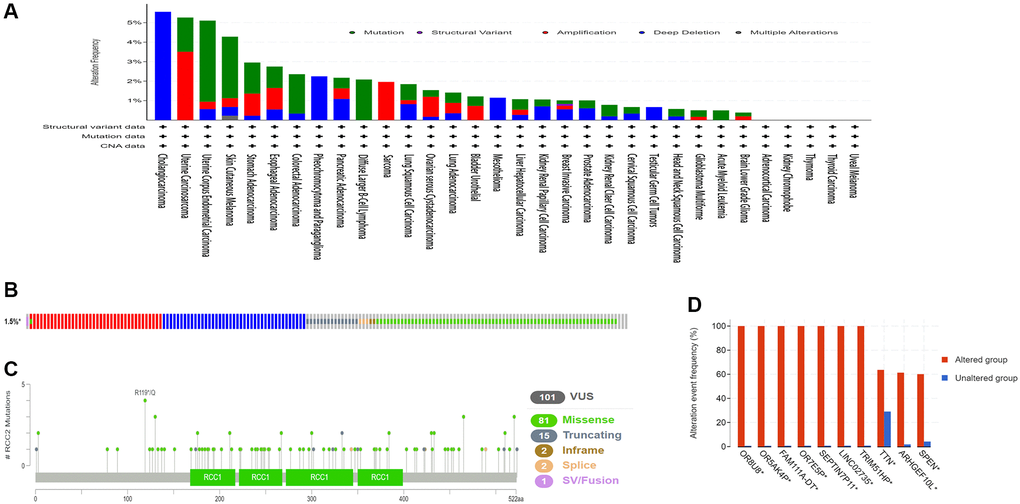
Figure 6. The genetic alterations characteristic of RCC2 in pan-cancers. (A) Mutation type and frequency in all TCGA tumors. (B) Summary of RCC2 structural variant, mutations, and copy-number alterations. (C)The site of different mutation types of RCC2. (D) The related genes alteration frequency in the RCC2 altered group and unaltered group.
Relationship of RCC2 expression with immune cell infiltration
Immunotherapy has emerged as a vital strategy for tumor treatment and has shown remarkable clinical effects. Therefore, we further investigated the immune microenvironment of tumors and the polymorphism of immune-related genes in immunotherapy. We investigated the association of immune cell infiltration and RCC2 expression by using the TISIDB database. The clustering heatmap illustrated that RCC2 expression was positively related to immune cells in KICH, KIRP, KIRC, LGG, thyroid carcinoma (THCA), and pheochromocytoma and paraganglioma (PCPG) tumors (Figure 7A). We further explored the “Gene” module of the TIMER2.0 database. The RCC2 gene was positively related to cancer-associated fibroblasts (CAFs) in KIRP tumors while was inversely correlated to CAFs in testicular germ cell tumors (TGCT) tumors. (Figure 7B).
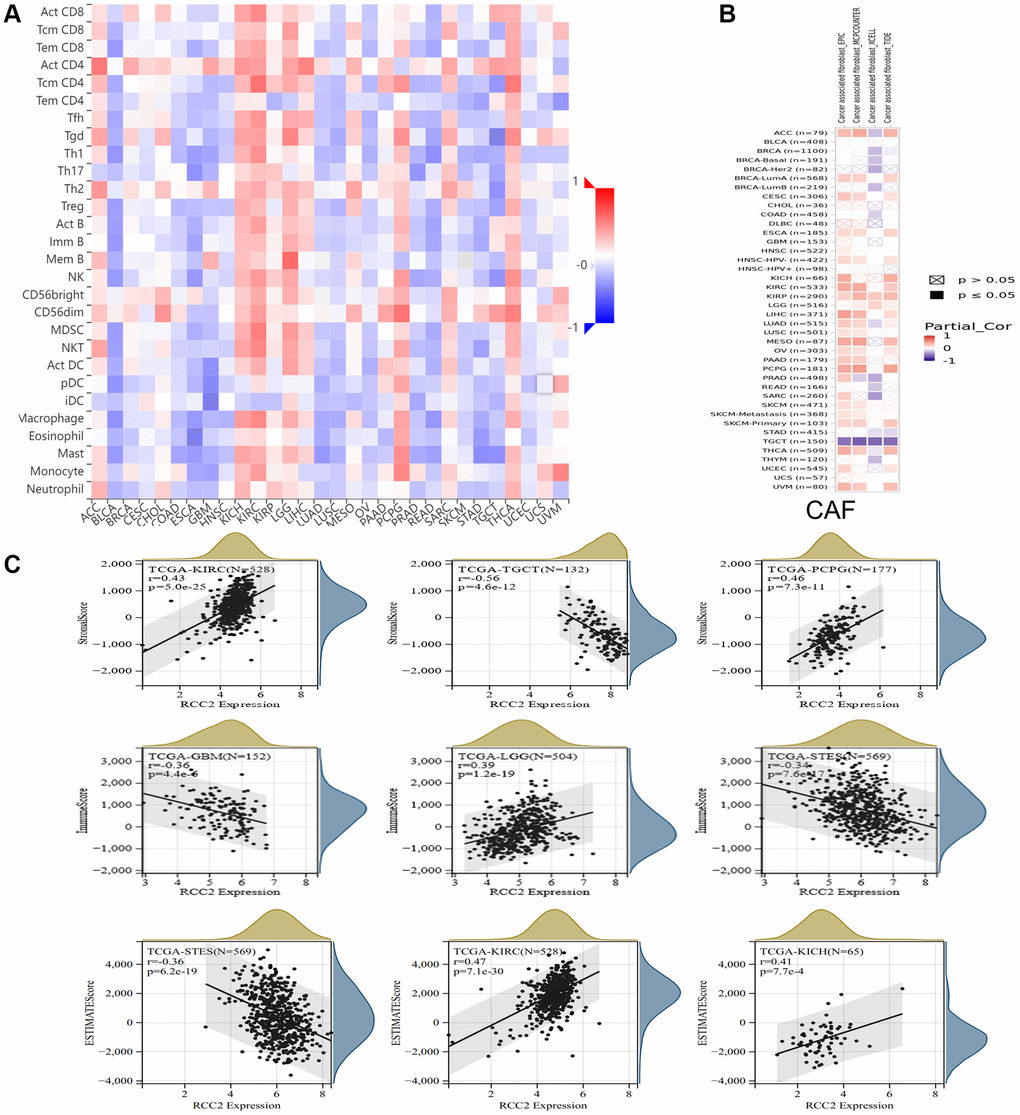
Figure 7. Relationship between RCC2 expression and immune microenvironment. (A) The correlation heat map shows the relationship between RCC2 expression and immune infiltrating cells. Red color represents positive correlation, and blue color represents negative correlation. (B) The relationship between RCC2 expression and CAFs. (C) The top three cancer types with the most significant correlation between the degree of immune infiltration and RCC2 expression were displayed.
The immune and stromal scores of cancer tissues were calculated using the ESTIMATE method, and the three tumors with the most significant correlation between the scores were selected separately. We finally observed that RCC2 expression was significantly associated with immune scores in 21 tumor types (Supplementary Figure 4) and was related to the stromal scores in 23 cancer types (Supplementary Figure 5). Among them, the most significant correlations were found between RCC2 expression and immune scores in LGG, GBM, and Stomach and Esophageal carcinoma (STES). For stromal scores, there was a significant correlation between KIRC, TGCT, and PCPG. In KICH and KIRP, RCC2 expression was positively correlated with ESTIMATE score, whereas it had negative correlation in STES (Figure 7C). We further analyzed the expression levels of RCC2 among immune subtypes in pan-cancers and we found a significant correlation between RCC2 and C1 (wound healing), C2 (IFN-gamma dominant), C3 (inflammatory), C4 (lymphocyte depleted), C5 (immunologically), and C6 (TGF-b dominant) in ACC, UCEC, TGCT, STAD, SARC, THCA, LGG, MESO, PAAD, LUSC, LUAD, KIRP, BLCA, ESCA, HNSC, KICH and KIRC (p < 0.05, Supplementary Figure 6). To further evaluated the efficacy of immunotherapy in patients with different expression levels of RCC2, we calculated the immunophenoscore (IPS) of patients with pan-cancers. We observed that RCC2 expression was negatively associated with the IPS score among thirteen different cancers, while it was positively associated with the IPS score in OV (Supplementary Figure 7).
Additionally, utilizing the TISIDB database, the association between RCC2 expression and immunotherapy were further analyzed, and statistically significant expression differences were only found between responders and non-responders in uroepithelial tumors (p = 0.00133, Supplementary Table 1). However, no statistically significant differences in mutations were seen between responders and non-responders.
Correlations between RCC2 expression and checkpoint gene markers
Next, we conducted a correlation analysis of RCC2 with chemokine and receptor using TISIDB database, and the results displayed that RCC2 expression was significantly distinct from that of chemokine in different tumors. We further revealed that the expression of RCC2 was negatively related to immunomodulators in most cancers. In BRCA, LUAD, READ, ESCA and STAD, RCC2 expression was negatively associated with chemokine and receptor. However, we discovered a positive correlation between RCC2 and chemokine in KIRP, KICH, KIRC, THCA, and LIHC (Figure 8A, 8B). We further explored the correlation of RCC2 expression and immunomodulator using the TSIIDB database. We observed that increased expression of RCC2 in ACC, KICH, KIRC, and THCA positively correlated with most immunosuppressive markers (Figure 8C). Among the immunostimulatory factors, IL6R, TNFRSF18, TNFRSF25, and ULBP1 were significantly associated with RCC2 expression in the majority of cancer types. However, in ESCA, LUSC, LUAD, BLCA, and SKCM, RCC2 expression level was negatively correlated with immunostimulatory marker genes (Figure 8D).
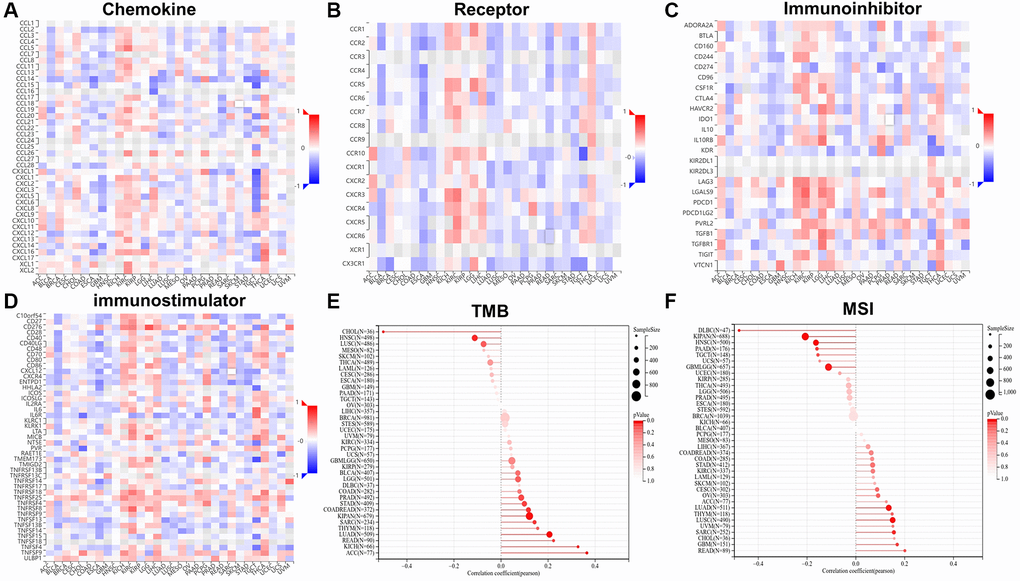
Figure 8. The relationship between RCC2 expression and chemokine (A), receptor (B), immunoinhibitors (C), immunostimulators (D), tumor mutation burden (TMB) (E) and microsatellite instability (MSI) (F).
Correlations between RCC2 expression and MSI and TMB
TMB and MSI are genome-wide biological markers in predicting the treatment efficacy of immune checkpoint inhibitors (ICIs). We then investigated the connection between RCC2 expression and MSI and TMB. The RCC2 expression level was positively associated with TMB in LUAD, COAD, SARC, KIPAN, STAD, READ, ACC, and KICH and negatively related to TMB in HNSC and CHOL (Figure 8E). In GBM, SARC, LUAD, and LUSC, RCC2 expression was positively related to MSI, while in LGG, KIPAN, HNSC, PAAD, and diffuse large B-cell lymphoma (DLBC), it was negatively related to MSI (Figure 8F).
Protein-protein interactions network and enrichment analysis of RCC2
We used STRING and GEPIA2 to create a protein interaction network for RCC2 and obtain RCC2-associated genes and performed enrichment analysis to investigate the potential molecular mechanisms of RCC2 in cancer occurrence and development. At STRING, we built 50 RCC2-binding proteins based on the results of experiments, and we utilized GEPIA2 to identify the top 100 genes related to RCC2 expression (Figure 9A). We analyzed the correlation of the top six-correlated genes and the results demonstrated that RCC2 was highly related to AUNIP, CCNF, TIMELESS, WDHD1, MSH2, and DLGAP5 (Figure 9B). Furthermore, in various cancer types, all six of these genes showed strong correlations (Figure 9C).
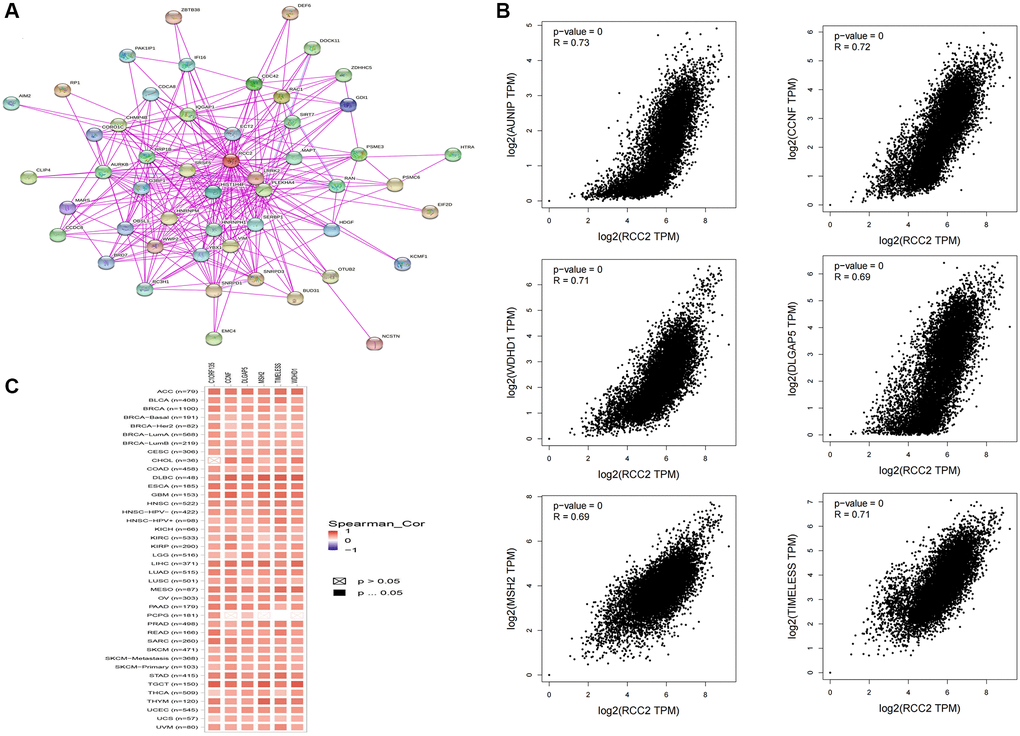
Figure 9. Co-expression network of RCC2 gene. (A) RCC2 binding proteins from the STRING website. (B) The “Expression analysis” module of GEPIA2 was used to obtain the 100 most closely related genes to RCC2 expression, and the 6 most significantly related genes were AUNIP, CCNF, TIMELESS, WDHD1, MSH2, and DLGAP5. (C) Heat map of the correlation between RCC2 and AUNIP, CCNF, TIMELESS, WDHD1, MSH2, and DLGAP5 in most cancer types.
Next, we performed GO and KEGG functional enrichment analysis on RCC2. The cellular components (CC) are mainly in the chromosome, spindle, chromosomal region, and centromeric region (Figure 10A). The biological processes (BP) are mainly in chromosome segregation, organelle fission, and mitotic nuclear division (Figure 10B). In addition, the enriched molecular functions (MF) are related to DNA-dependent ATPase activity, single-stranded DNA binding, and DNA replication origin binding (Figure 10C). According to KEGG analysis, the main enrichment pathways are cell cycle, spliceosome, and DNA replication-related pathways (Figure 10D).
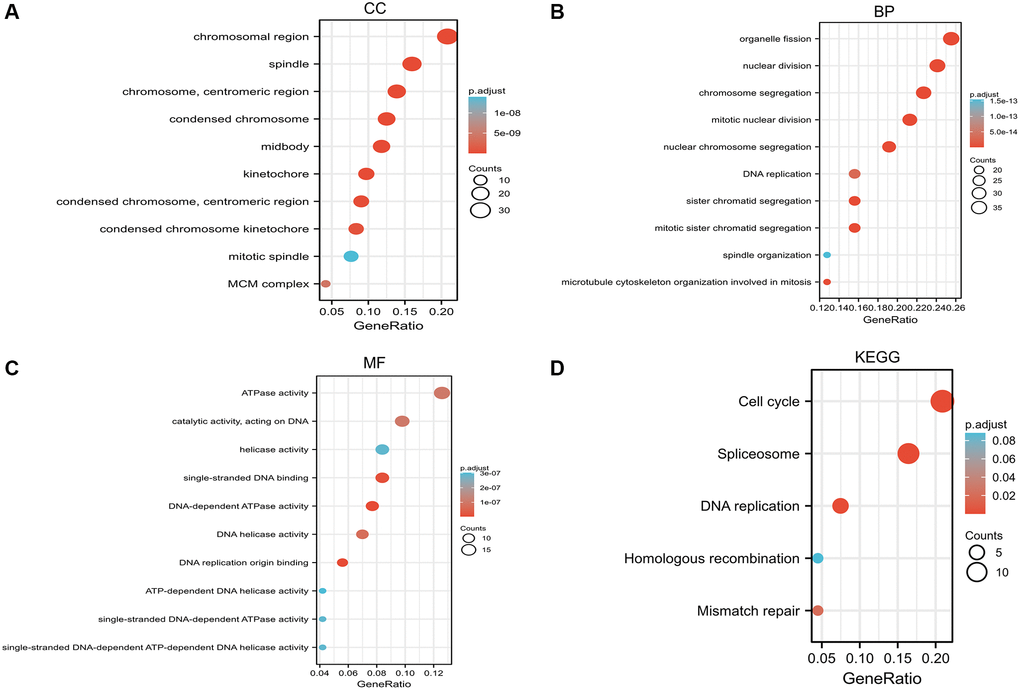
Figure 10. Gene Ontology (GO) enrichment and Kyoto Encyclopedia of Genes and Genomes (KEGG) pathway analysis based on RCC2 binding proteins and candidate genes. (A) Cellular component (CC). (B) Biological process (BP). (C) Molecular function (MF). (D) KEGG pathway.
Discussion
RCC2 is a cell cycle gene regulator associated with mitotic spindle formation, membrane dynamics, and cell cycle progression. It has a similarity to Ran’s known guanine nucleotide exchange factor. In addition, previous studies have shown that inhibition of RCC2 blocks prophase cell activity, alters cell morphology, and increases apoptosis. RCC2 is thought to be a regulator of cell migration and tumor metastasis. It was reported that RCC2 overexpression promoted Wnt signaling pathway activation and induced EMT promoting an aggressive phenotype in breast cancer [4]. Lin et al. also showed that the upregulation of RCC2 was involved in cigarette smoke extract (CSE)-induced autophagy and EMT in lung cancer cells [10]. In recent years, it has been shown that RCC2 is a potent biomarker for hepatocellular and ovarian cancers [6, 11]. However, its role in pan-cancer is less understood.
In the present study, we analyzed the results by using data from the TIMER2.0 database showing that RCC2 was overexpressed in most types of cancer relative to normal tissue, while it was only found to be downregulated in KICH. Differences in mRNA expression levels of the RCC2 in various cancer types indicated its diverse roles in cancer development. Based on the CPTAC database, we discovered that the RCC2 protein was overexpressed in PAAD, BRCA, COAD, GBM, and OV tumors. Previous research revealed that the RCC2 was elevated in breast cancer, ovarian cancer, and lung cancer [4, 5, 11]. These studies are consistent with our findings. Moreover, we found differential RCC2 expression between different pathological stages in several tumors. In KIRC and KIRP, RCC2 expression increased with stage, and the elevated RCC2 expression was correlated with inferior survival, which suggested that RCC2 may play a critical role in the carcinogenesis of KIRC and KIRP.
Moreover, we analyzed the prognostic value of RCC2 in different tumor types. Our study found that RCC2 overexpression was associated with LIHC, KIRP, KIRC, PAAD, and SARC with an inferior prognosis. However, in BRCA, ESCA, CESC, THYM, and STAD tumors, elevated RCC2 was related to a favorable prognosis. KM survival analysis demonstrated that RCC2 expression was correlated with unfavorable prognosis in lung adenocarcinoma. Previous research revealed that RCC2 overexpression regulates the epithelial-mesenchymal transition and extracellular matrix remodeling of LUAD through JNK activation, thereby promoting the proliferation and metastasis of LUAD in vivo and in vitro [5]. These findings implied that RCC2 may play an oncogenic role in many cancer types, and high expression of RCC2 was correlated with a poorer survival outcome in hepatocellular carcinoma, which was in line with previous studies [6, 12]. However, some studies also found that RCC2 played a role in promoting tumor growth and invasion in breast and esophageal cancers [4, 8]. The results of our analysis were inconsistent with previous studies, possibly due to different sample sizes in different databases. These results may suggest that RCC2 plays different functions in different tumor types and could be used as a novel biomarker. However, the mechanism of RCC2 in different tumors needs to be further explored.
Gene mutations are involved in tumor development, and gene mutation detection also plays a vital role in the treatment of cancer patients. There are few studies on RCC2 gene alterations in pan-cancers. In our study, we identified the mutations as the main type of genetic alterations in RCC2 in pan-cancers. We also explored that RCC2 mutations were most frequent in stomach adenocarcinoma. However, we did not find a significant correlation between RCC2 mutations and immunotherapy response.
The previous study revealed that CAFs have a role in promoting tumor progression [13]. CAFs can secrete large amounts of growth factors and pro-inflammatory cytokines and chemokines to assist immune escape [14]. As tumor cells continue to evade immune surveillance, immunosuppressive factors, like regulatory T cells, are upregulated in the TME. Our results showed that the RCC2 gene was positively related to CAFs in most tumors and negatively associated with CAFs in TGCT tumors. It is suggested that the RCC2 gene has a critical role of RCC2 gene in regulating tumor immune microenvironment and the formation of CAFs, and the potential mechanism of RCC2 regulation of CAFs needs further study. Targeting RCC2 may be a prospective therapeutic approach for cancer.
Interactions between immune cells and other cells in the TME largely determine the intensity of anti-tumor immune response. According to the ESTIMATE analysis, the correlation of RCC2 expression and immune-associated cell infiltration also occurred in pan-cancer. We observed a negative correlation of the stromal component and TME in 14 tumors, including GBM, LUAD, COAD, READ, BRCA, ESCA, STES, STAD, UCEC, HNSC, LUSC, SKCM-M, SKCM, TGCT, and BLCA. Besides, RCC2 expression was significantly negatively associated with the immune score in 13 tumors, including GBM, CESC, LUAD, ESCA, STES, STAD, UCEC, LUSC, SKCM-M, SKCM, OV, SKCM-P, and BLCA. To date, there is still a gap in understanding the roles of RCC2 in the immune system. The roles of RCC2 in tumor immune microenvironment remains a new area worthy of further investigation.
Our correlation analysis also unraveled a close relationship between the RCC2 level and the biological progression of various immune-related genes. In addition, we found that RCC2 was co-expressed with MHC, immunosuppressive factors, immunostimulatory factors, receptors, and chemokines in most cancer types. RCC2 showed a significant negative expression relationship with kinase insert domain receptor (KDR) in 20 of the 30 tumors. KDR regulates tumor angiogenesis and migration, previous work has demonstrated that KDR expression is strongly related to clinical outcomes and drug sensitivity in glioma and thyroid cancer [15, 16]. Meanwhile, IPS scores also play a critical role in predicting the response of cancer patients to ICI, and we can observe that high expression of RCC2 in some cancers leads to a decrease in immune scores, which may lead to rapid tumor progression. In uroepithelial carcinoma, low expression of RCC2 is more likely to produce an immune response to atezolizumab, which facilitates the clinical survival of patients. These findings implied that RCC2 expression was closely related to immune infiltration of tumor cells and affected the immunotherapy respondence, providing a new target for improving immunotherapy in patients with various types of cancer. Meanwhile, TISIDB data showed considerable differences in RCC2 expression in distinct cancer immune subtypes, implying that RCC2 may serve as a valid biomarker for differentiating immune subtypes. In summary, RCC2 was significantly expressed in many immune subtypes of tumors and associated with immune checkpoint genes and immune cell infiltration, suggesting RCC2 may be involved in TME remodeling and affected the immunotherapeutic response of tumors.
TMB, which is a more tolerable predictor of the efficacy of ICIs, correlates with the efficacy of multiple tumor types of ICIs alone or in combination with two ICIs, and can be applied as a predictive marker of the immunotherapy efficacy [17, 18]. The increasing level of TMB represented higher possibility of neoantigens generation and the immune response rate [19]. Microsatellite instability (MSI) refers to variations in microsatellite length brought on by the insertion or deletion of microsatellite repeats in tumor tissues (MSI). MSI plays an essential role in the screening, treatment, and prognosis of cancers. MSI is a common phenomenon in tumors, which can predict the occurrence and progression of cancers and can also play an indispensable role in supporting diagnosis and drug guidance in different cancer types [20]. It has been shown that RCC2 can be used as a prognostic marker in the MSI subgroup in colon cancer [21]. At present, in our results, we observed that RCC2 expression was significantly related to TMB in COAD, READ, SARC, KIPAN, LUAD, STAD, READ, KICH, HNSC, and CHOL and was with MSI in GBM, LUAD, SARC, LUSC, GBMLGG, KIPAN, HNSC, PAAD, and DLBC.
There are still some limitations to the study. Firstly, most of the data were obtained from public databases, and different algorithms among different databases may result in bias in some findings, and further explorations are needed to validate the molecular mechanisms of RCC2 in various tumors in the future. Secondly, the small sample size in several cancer types could also bring some bias to the analysis results.
Conclusions
The present study revealed that RCC2 was overexpressed in the majority of cancer tissues and affects clinical prognosis. The different outcomes of RCC2 expression in diverse cancers prompted further exploration of its specific role in individual cancer. In addition, the expression of RCC2 was related to immune cell infiltration, TMB, and MSI, and may influence the immunotherapeutic efficacy. Our comprehensive analysis highlighted the possibility of RCC2 as a promising biomarker for diagnosis and therapy and may contribute to the precision and individualized cancer therapeutic strategies.
Materials and Methods
Gene expression analysis
The Tumor Immune Estimation Resource (TIMER2) database is used to systematically analyze the immune infiltration of various tumors and to generate visual charts [22]. It has six advanced algorithms: TIMER, XCELL, CIBERSORT, CIBERSORT-ABS, TIDE, QUANTISEQ, EPIC and MCPCOUNTER. We download RCC2 expression data in various malignancies and corresponding adjacent tissues through the “Gene_DE” module of TIMER2.0. RCC2 expression level between adjacent normal and tumor tissues was assessed by Student’s t-test. The p < 0.05 was regarded as a statistically significant difference [23, 24].
UALCAN is an interactive web resource to perform analysis of cancer transcriptomic data from 31 cancer types in TCGA [25]. We used UALCAN to obtain the RCC2 methylation data in different cancers. In addition, we also downloaded the mutation data of RCC2 in pan-cancer from cBioPortal. Mutation data, including mutation type, alteration frequency, and mutated site information.
Gene Set Cancer Analysis (GSCALite) is a web server that integrates genomics and immunomics based on the TCGA database [26]. By downloading the RCC2 expression and different tumor clinicopathological stages using the GSCALite website, we further used the Tumor-Immune System Interactions and Drug Bank (TISIDB) to explore the RCC2 expression in various molecular subtypes of cancers [27].
Gene alteration analysis
We used cBioPortal for Cancer Genomics tool to download the data on mutation type, alteration frequency, and copy number alteration (CNA) in pan-cancer patients [28, 29].
Validation of protein expression in pancancer
Clinical Proteomic Tumor Analysis Consortium (CPTAC) integrates proteomic and genomic data and aims to identify and characterize the full range of proteins in tumor and normal tissues [30, 31]. The Human Protein Atlas project (HPA) has systematically generated antibodies against human proteins for profiling cancer-specific protein expression in tissues and cells [32]. We obtained differential RCC2 proteome expression and immunohistochemical (IHC) images in pan-cancer by integrating two databases.
Survival prognosis analysis
Kaplan-Meier (KM) Plotter is a public platform that can quickly confirm the prognosis of disease [33]. We applied KM Plotter to explore the correlation between RCC2 gene expression of relapse-free survival (RFS) and overall survival (OS) across all TCGA tumors. The hazard ratios (HRs) and 95% confidence intervals (CI) were calculated [34].
Immune feature analysis
We investigated the association between RCC2 expression and immune cell infiltration in all cancer types using the “immune correlation” module of the TIMER2 and the TISIDB database. Then, we further explored the relationship of RCC2 expression with TMB and MSI using the Sangerbox 3.0 online website [35]. ESTIMATE scores presented an abundance of stromal and immune components. The correlation between RCC2 expression and immunological and stromal scores was determined using the Spearman correlation analysis.
Protein-protein interaction network and gene enrichment analysis
We then utilized the Search Tool for the Retrieval of Interacting Genes/Proteins (STRING) website for analysis of the protein interactions network [36]. Enter the RCC2 gene and choose homo sapiens for the Organism. The basic settings are adjusted according to the following parameter information: The first shell’s settings for the network included “full STRING network,” “experiments only,” “meaning of network edges as evidence,” “Low confidence (0.150)”, and “no more than 50 interactors”.
Gene Expression Profiling Interactive Analysis (GEPIA2) is an online database, which was able to analyze RNA-seq expression data from a total of 8587 normal samples and 9736 tumor samples from TCGA and GTEx projects [37]. The top 100 RCC2-associated genes were obtained by GEPIA2. Pearson correlation analysis was then applied for RCC2 and the top 6 selected genes, and correlation coefficients (R) and p values were calculated. A heat map of the correlation of RCC2-associated gene expression profiles in pan-cancer was downloaded using the TIMER2 database, containing p-values and partial correlations (cor) from the purity-adjusted Spearman rank correlation test.
We integrated 100 candidate genes and 50 binding proteins acquired from the two databases for the Kyoto Encyclopedia of Genes and Genomes (KEGG) pathway analysis and Gene Ontology (GO) functional enrichment. Enrichment analysis was performed using the “clusterProfiler” R package to obtain the results of gene set enrichment and to determine the potential functions and pathways of genes [38]. The “ggplot2” visualizes the top ten enrichment entries as bubble plots.
Data availability statement
The datasets presented in this study can be found in online repositories. The names of the repository/repositories and accession number(s) can be found in the article/Supplementary Material.
Author Contributions
YYZ and LFS contributed to the conception of the study. XXL, KK, YHP, LS and YYZ contributed to the data analysis and figure generation. XXL wrote the manuscript. YYZ and LFS revised the manuscript. All authors approved the final version of the manuscript.
Conflicts of Interest
The authors declare that the research was conducted in the absence of any commercial or financial relationships that could be construed as a potential conflict of interest.
Funding
This study was supported by the National Natural Science Foundation of China (82203353), the Hunan Provincial Natural Science Foundation of China (2022JJ40851) and the Youth Research Foundation of Xiangya Hospital, Central South University (2021Q16).
References
- 1. Mollinari C, Reynaud C, Martineau-Thuillier S, Monier S, Kieffer S, Garin J, Andreassen PR, Boulet A, Goud B, Kleman JP, Margolis RL. The mammalian passenger protein TD-60 is an RCC1 family member with an essential role in prometaphase to metaphase progression. Dev Cell. 2003; 5:295–307. https://doi.org/10.1016/s1534-5807(03)00205-3 [PubMed]
- 2. Papini D, Langemeyer L, Abad MA, Kerr A, Samejima I, Eyers PA, Jeyaprakash AA, Higgins JM, Barr FA, Earnshaw WC. TD-60 links RalA GTPase function to the CPC in mitosis. Nat Commun. 2015; 6:7678. https://doi.org/10.1038/ncomms8678 [PubMed]
- 3. Humphries JD, Byron A, Bass MD, Craig SE, Pinney JW, Knight D, Humphries MJ. Proteomic analysis of integrin-associated complexes identifies RCC2 as a dual regulator of Rac1 and Arf6. Sci Signal. 2009; 2:ra51. https://doi.org/10.1126/scisignal.2000396 [PubMed]
- 4. Chen Z, Wu W, Huang Y, Xie L, Li Y, Chen H, Li W, Yin D, Hu K. RCC2 promotes breast cancer progression through regulation of Wnt signaling and inducing EMT. J Cancer. 2019; 10:6837–47. https://doi.org/10.7150/jca.36430 [PubMed]
- 5. Pang B, Wu N, Guan R, Pang L, Li X, Li S, Tang L, Guo Y, Chen J, Sun D, Sun H, Dai J, Bai J, et al. Overexpression of RCC2 Enhances Cell Motility and Promotes Tumor Metastasis in Lung Adenocarcinoma by Inducing Epithelial-Mesenchymal Transition. Clin Cancer Res. 2017; 23:5598–610. https://doi.org/10.1158/1078-0432.CCR-16-2909 [PubMed]
- 6. Chen Q, Jiang P, Jia B, Liu Y, Zhang Z. RCC2 contributes to tumor invasion and chemoresistance to cisplatin in hepatocellular carcinoma. Hum Cell. 2020; 33:709–20. https://doi.org/10.1007/s13577-020-00353-7 [PubMed]
- 7. Yu H, Zhang S, Ibrahim AN, Wang J, Deng Z, Wang M. RCC2 promotes proliferation and radio-resistance in glioblastoma via activating transcription of DNMT1. Biochem Biophys Res Commun. 2019; 516:999–1006. https://doi.org/10.1016/j.bbrc.2019.06.097 [PubMed]
- 8. Calderon-Aparicio A, Yamamoto H, De Vitto H, Zhang T, Wang Q, Bode AM, Dong Z. RCC2 Promotes Esophageal Cancer Growth by Regulating Activity and Expression of the Sox2 Transcription Factor. Mol Cancer Res. 2020; 18:1660–74. https://doi.org/10.1158/1541-7786.MCR-19-1152 [PubMed]
- 9. Zhou Y, Lih TM, Pan J, Höti N, Dong M, Cao L, Hu Y, Cho KC, Chen SY, Eguez RV, Gabrielson E, Chan DW, Zhang H, Li QK. Proteomic signatures of 16 major types of human cancer reveal universal and cancer-type-specific proteins for the identification of potential therapeutic targets. J Hematol Oncol. 2020; 13:170. https://doi.org/10.1186/s13045-020-01013-x [PubMed]
- 10. Lin H, Zhang X, Feng N, Wang R, Zhang W, Deng X, Wang Y, Yu X, Ye X, Li L, Qian Y, Yu H, Qian B. LncRNA LCPAT1 Mediates Smoking/ Particulate Matter 2.5-Induced Cell Autophagy and Epithelial-Mesenchymal Transition in Lung Cancer Cells via RCC2. Cell Physiol Biochem. 2018; 47:1244–58. https://doi.org/10.1159/000490220 [PubMed]
- 11. Gong S, Chen Y, Meng F, Zhang Y, Wu H, Li C, Zhang G. RCC2, a regulator of the RalA signaling pathway, is identified as a novel therapeutic target in cisplatin-resistant ovarian cancer. FASEB J. 2019; 33:5350–65. https://doi.org/10.1096/fj.201801529RR [PubMed]
- 12. Xiong DD, Feng ZB, Lai ZF, Qin Y, Liu LM, Fu HX, He RQ, Wu HY, Dang YW, Chen G, Luo DZ. High throughput circRNA sequencing analysis reveals novel insights into the mechanism of nitidine chloride against hepatocellular carcinoma. Cell Death Dis. 2019; 10:658. https://doi.org/10.1038/s41419-019-1890-9 [PubMed]
- 13. Chen X, Song E. Turning foes to friends: targeting cancer-associated fibroblasts. Nat Rev Drug Discov. 2019; 18:99–115. https://doi.org/10.1038/s41573-018-0004-1 [PubMed]
- 14. Chen Y, McAndrews KM, Kalluri R. Clinical and therapeutic relevance of cancer-associated fibroblasts. Nat Rev Clin Oncol. 2021; 18:792–804. https://doi.org/10.1038/s41571-021-00546-5 [PubMed]
- 15. Pozdeyev N, Gay LM, Sokol ES, Hartmaier R, Deaver KE, Davis S, French JD, Borre PV, LaBarbera DV, Tan AC, Schweppe RE, Fishbein L, Ross JS, et al. Genetic Analysis of 779 Advanced Differentiated and Anaplastic Thyroid Cancers. Clin Cancer Res. 2018; 24:3059–68. https://doi.org/10.1158/1078-0432.CCR-18-0373 [PubMed]
- 16. Zaman N, Dass SS, DU Parcq P, Macmahon S, Gallagher L, Thompson L, Khorashad JS, LimbÄck-Stanic C. The KDR (VEGFR-2) Genetic Polymorphism Q472H and c-KIT Polymorphism M541L Are Associated With More Aggressive Behaviour in Astrocytic Gliomas. Cancer Genomics Proteomics. 2020; 17:715–27. https://doi.org/10.21873/cgp.20226 [PubMed]
- 17. Goodman AM, Kato S, Bazhenova L, Patel SP, Frampton GM, Miller V, Stephens PJ, Daniels GA, Kurzrock R. Tumor Mutational Burden as an Independent Predictor of Response to Immunotherapy in Diverse Cancers. Mol Cancer Ther. 2017; 16:2598–608. https://doi.org/10.1158/1535-7163.MCT-17-0386 [PubMed]
- 18. Labriola MK, Zhu J, Gupta RT, McCall S, Jackson J, Kong EF, White JR, Cerqueira G, Gerding K, Simmons JK, George D, Zhang T. Characterization of tumor mutation burden, PD-L1 and DNA repair genes to assess relationship to immune checkpoint inhibitors response in metastatic renal cell carcinoma. J Immunother Cancer. 2020; 8:e000319. https://doi.org/10.1136/jitc-2019-000319 [PubMed]
- 19. Conway JR, Kofman E, Mo SS, Elmarakeby H, Van Allen E. Genomics of response to immune checkpoint therapies for cancer: implications for precision medicine. Genome Med. 2018; 10:93. https://doi.org/10.1186/s13073-018-0605-7 [PubMed]
- 20. Baretti M, Le DT. DNA mismatch repair in cancer. Pharmacol Ther. 2018; 189:45–62. https://doi.org/10.1016/j.pharmthera.2018.04.004 [PubMed]
- 21. Bruun J, Kolberg M, Ahlquist TC, Røyrvik EC, Nome T, Leithe E, Lind GE, Merok MA, Rognum TO, Bjørkøy G, Johansen T, Lindblom A, Sun XF, et al. Regulator of Chromosome Condensation 2 Identifies High-Risk Patients within Both Major Phenotypes of Colorectal Cancer. Clin Cancer Res. 2015; 21:3759–70. https://doi.org/10.1158/1078-0432.CCR-14-3294 [PubMed]
- 22. Li T, Fu J, Zeng Z, Cohen D, Li J, Chen Q, Li B, Liu XS. TIMER2.0 for analysis of tumor-infiltrating immune cells. Nucleic Acids Res. 2020; 48:W509–14. https://doi.org/10.1093/nar/gkaa407 [PubMed]
- 23. Wu G, Zhao Z, Yan Y, Zhou Y, Wei J, Chen X, Lin W, Ou C, Li J, Wang X, Xiong K, Zhou J, Xu Z. CPS1 expression and its prognostic significance in lung adenocarcinoma. Ann Transl Med. 2020; 8:341. https://doi.org/10.21037/atm.2020.02.146 [PubMed]
- 24. Wu G, Yan Y, Zhou Y, Wang X, Wei J, Chen X, Lin W, Ou C, Zhou J, Xu Z. Expression and clinical significance of CPS1 in glioblastoma multiforme. Curr Res Transl Med. 2019; 67:123–8. https://doi.org/10.1016/j.retram.2019.08.003 [PubMed]
- 25. Chandrashekar DS, Bashel B, Balasubramanya SAH, Creighton CJ, Ponce-Rodriguez I, Chakravarthi BVS, Varambally S. UALCAN: A Portal for Facilitating Tumor Subgroup Gene Expression and Survival Analyses. Neoplasia. 2017; 19:649–58. https://doi.org/10.1016/j.neo.2017.05.002 [PubMed]
- 26. Liu CJ, Hu FF, Xia MX, Han L, Zhang Q, Guo AY. GSCALite: a web server for gene set cancer analysis. Bioinformatics. 2018; 34:3771–2. https://doi.org/10.1093/bioinformatics/bty411 [PubMed]
- 27. Ru B, Wong CN, Tong Y, Zhong JY, Zhong SSW, Wu WC, Chu KC, Wong CY, Lau CY, Chen I, Chan NW, Zhang J. TISIDB: an integrated repository portal for tumor-immune system interactions. Bioinformatics. 2019; 35:4200–2. https://doi.org/10.1093/bioinformatics/btz210 [PubMed]
- 28. Cerami E, Gao J, Dogrusoz U, Gross BE, Sumer SO, Aksoy BA, Jacobsen A, Byrne CJ, Heuer ML, Larsson E, Antipin Y, Reva B, Goldberg AP, et al. The cBio cancer genomics portal: an open platform for exploring multidimensional cancer genomics data. Cancer Discov. 2012; 2:401–4. https://doi.org/10.1158/2159-8290.CD-12-0095 [PubMed]
- 29. Gao J, Aksoy BA, Dogrusoz U, Dresdner G, Gross B, Sumer SO, Sun Y, Jacobsen A, Sinha R, Larsson E, Cerami E, Sander C, Schultz N. Integrative analysis of complex cancer genomics and clinical profiles using the cBioPortal. Sci Signal. 2013; 6:pl1. https://doi.org/10.1126/scisignal.2004088 [PubMed]
- 30. Edwards NJ, Oberti M, Thangudu RR, Cai S, McGarvey PB, Jacob S, Madhavan S, Ketchum KA. The CPTAC Data Portal: A Resource for Cancer Proteomics Research. J Proteome Res. 2015; 14:2707–13. https://doi.org/10.1021/pr501254j [PubMed]
- 31. Chandrashekar DS, Karthikeyan SK, Korla PK, Patel H, Shovon AR, Athar M, Netto GJ, Qin ZS, Kumar S, Manne U, Creighton CJ, Varambally S. UALCAN: An update to the integrated cancer data analysis platform. Neoplasia. 2022; 25:18–27. https://doi.org/10.1016/j.neo.2022.01.001 [PubMed]
- 32. Pontén F, Jirström K, Uhlen M. The Human Protein Atlas--a tool for pathology. J Pathol. 2008; 216:387–93. https://doi.org/10.1002/path.2440 [PubMed]
- 33. Lánczky A, Győrffy B. Web-Based Survival Analysis Tool Tailored for Medical Research (KMplot): Development and Implementation. J Med Internet Res. 2021; 23:e27633. https://doi.org/10.2196/27633 [PubMed]
- 34. Zhou Y, Su W, Liu H, Chen T, Höti N, Pei H, Zhu H. Fatty acid synthase is a prognostic marker and associated with immune infiltrating in gastric cancers precision medicine. Biomark Med. 2020; 14:185–99. https://doi.org/10.2217/bmm-2019-0476 [PubMed]
- 35. Shen W, Song Z, Zhong X, Huang M, Shen D, Gao P, Qian X, Wang M, He X, Wang T, Li S, Song X. Sangerbox: A comprehensive, interaction-friendly clinical bioinformatics analysis platform. iMeta. 2022; 1:e36. https://doi.org/10.1002/imt2.36
- 36. Szklarczyk D, Gable AL, Nastou KC, Lyon D, Kirsch R, Pyysalo S, Doncheva NT, Legeay M, Fang T, Bork P, Jensen LJ, von Mering C. The STRING database in 2021: customizable protein-protein networks, and functional characterization of user-uploaded gene/measurement sets. Nucleic Acids Res. 2021; 49:D605–12. https://doi.org/10.1093/nar/gkaa1074 [PubMed]
- 37. Tang Z, Kang B, Li C, Chen T, Zhang Z. GEPIA2: an enhanced web server for large-scale expression profiling and interactive analysis. Nucleic Acids Res. 2019; 47:W556–60. https://doi.org/10.1093/nar/gkz430 [PubMed]
- 38. Yu G, Wang LG, Han Y, He QY. clusterProfiler: an R package for comparing biological themes among gene clusters. OMICS. 2012; 16:284–7. https://doi.org/10.1089/omi.2011.0118 [PubMed]