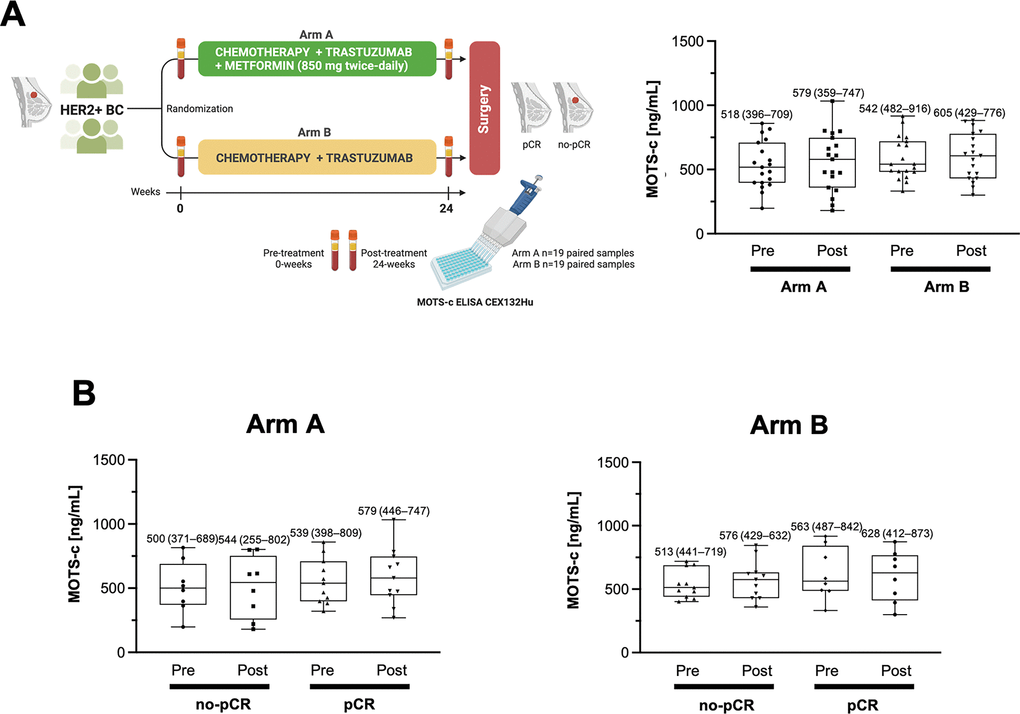
Figure 1.Circulating levels of MOTS-c in patients with HER2+ breast cancer treated with neoadjuvant metformin. (A) Left. METTEN study design. Circulating MOTS-c levels were determined through blood draws obtained at pre- (0 weeks) and post- (24 weeks) treatment using a commercial ELISA kit (CloudClone Corp., Wuhan, China; Catalog No. CEX132Hu). Right. Box plot (median, 25%–75% quartiles and minimal and maximal values) of the pre- and post-treatment distribution of circulating MOTS-c in women randomized to arms A (metformin-containing) and B (without metformin). (B) Box plot (median, 25%–75% quartiles and minimal and maximal values) of the pre- and post-treatment distribution of circulating MOTS-c in non-pCR and pCR groups. No between-group comparisons reached statistical significance in A and B.