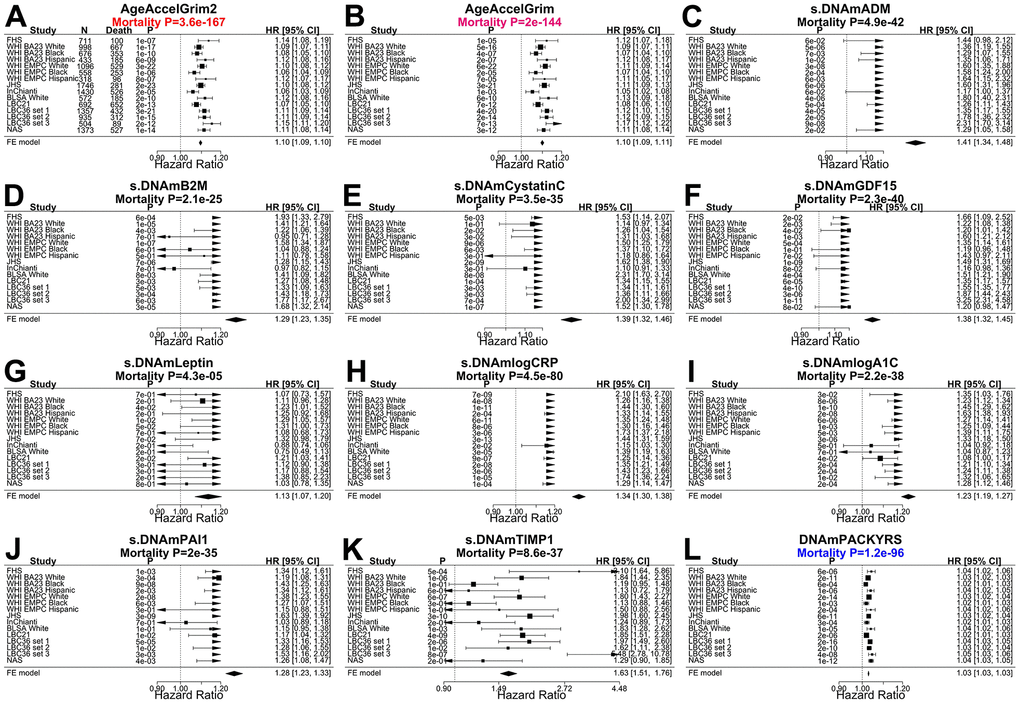
Figure 2.Meta analysis forest plots for predicting time-to-death due to all-cause mortality. Fixed effect meta analysis was performed to combine mortality analysis across 15 strata from 9 study cohorts: FHS test data, Women’s Health Initiatives (WHI) BA23, WHI EMPC, Jackson Heart Study (JHS), InCHIANTI (baseline and the third follow-up), Baltimore Longitudinal Study of Aging (BLSA), Lothian Birth Cohort 1921 (LBC21) and LBC 1936 (LBC36), and Normative Aging Study (NAS). Each panel reports a meta analysis forest plot for combining hazard ratios predicting time-to-death based on a DNAm based biomarker (reported in the figure heading) across different strata formed by racial group within cohort and set within LBC36. (A, B) display the results for AgeAccelGrim2 and AgeAccelGrim. Each row reports a hazard ratio (for time-to-death) and a 95% confidence interval resulting from a Cox regression model in each of 15 strata. (C–L) display the results for (age-adjusted) DNAm based surrogate markers of (C) adrenomedullin (ADM), (D) beta-2 microglobulin (B2M), (E) cystatin C (Cystatin C), (F) growth differentiation factor 15 (GDF-15), (G) leptin, (H) log scale of C reactive protein (CRP), (I) log scale of hemoglobin A1C, (J) plasminogen activation inhibitor 1 (PAI-1), (K) tissue inhibitor metalloproteinase 1 (TIMP-1) and (L) smoking pack-years (PACKYRS). The sub-title of each panel reports the meta analysis P-value. (A, B) Each hazard ratio (HR) corresponds to a one-year increase in AgeAccel. (C–K) Each hazard ratio corresponds to an increase in one-standard deviation. (L) Hazard ratios correspond to a one-year increase in pack-years. The most significant meta analysis P-value is marked in red (AgeAccelGrim2), followed by hot pink (AgeAccelGrim) and blue (DNAm PACKYRS), respectively.