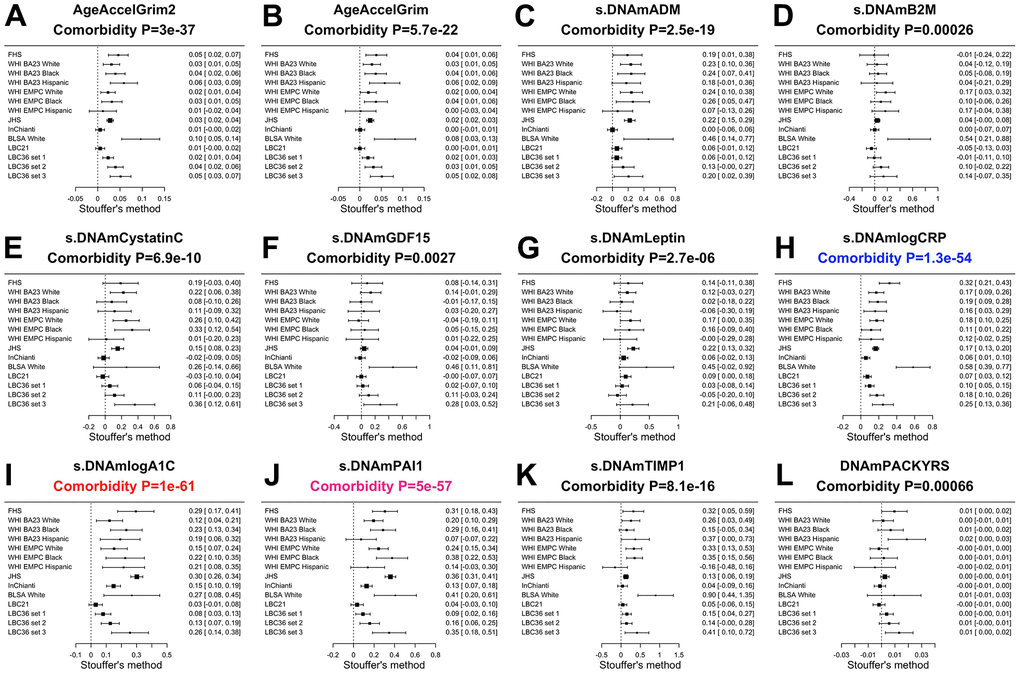
Figure 5.Meta analysis of associations with total number of age-related conditions. Each panel reports a meta analysis forest plot based on Stouffer’s method for combining regression analysis Z statistics between the comorbidity index and the DNAm-based biomarker (reported in the figure heading) across different strata, which are formed by racial group within cohort and set within LBC36. (A, B) display the results for AgeAccelGrim2 and AgeAccelGrim. (C–L) display the results for scaled DNAm based surrogate markers of (C) adrenomedullin (ADM), (D) beta-2 microglobulin (B2M), (E) cystatin C (Cystatin C), (F) growth differentiation factor 15 (GDF-15), (G) leptin, (H) log scale of C reactive protein (CRP), (I) log scale of hemoglobin A1C, (J) plasminogen activation inhibitor 1 (PAI-1), (K) tissue inhibitor metalloproteinase 1 (TIMP-1) and (L) smoking pack-years (PACKYRS). The sub-title of each panel reports the meta analysis p-value. Each row reports a beta coefficient β and a 95% confidence interval resulting from a (linear-mixed) regression model in each strata (defined by cohort racial group). (A, B) Each β corresponds to a one-year increase in AgeAccel. (C–K) Each β corresponds to an increase in one-standard deviation. (L) β corresponds to a one-year increase in pack-years. The most significant meta-analysis P-value is marked in red (DNAm logA1C), followed by hot pink (DNAm PAI1) and blue (DNAm logCRP), respectively.