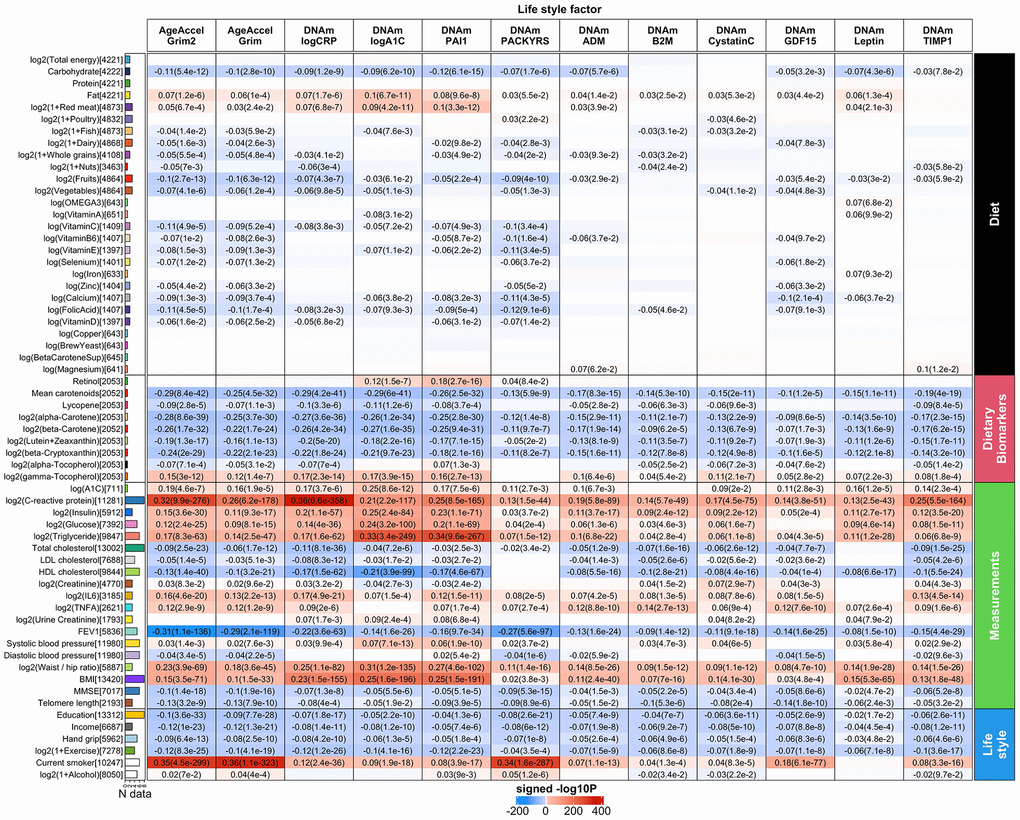
Figure 6.Meta cross-sectional correlations with diet, clinical biomarkers and lifestyle factors. Robust correlation coefficients (biweight midcorrelation [26]) between 1) AgeAccelGrim2, AgeAccelGrim, and ten age-adjusted underlying DNAm-based surrogate biomarkers underlying DNAmGrimAge2, and 2) 61 variables including 27 self-reported diet, 9 dietary biomarkers, 19 clinically relevant measurements related to vital signs, metabolic traits, inflammatory markers, cognitive function, lung function, central adiposity and leukocyte telomere length, and 6 lifestyle factors including hand grip strength. The y-axis lists variables in the format of name (sample size), followed by a bar plot denoting number of studies. Variables are arranged by category displayed on the right annotation. The x-axis lists AgeAccelGrim2, AgeAccelGrim, followed by DNAm estimates of log CRP, log A1C, PAI-1, smoking pack-years, etc. Each cell presents meta bicor estimates and P-value, provided P<0.1. The color gradient is based on -log10 P-values times sign of bicor. P-values are unadjusted. An analogous analysis stratified by gender can be found in Supplementary Figure 12.
Figure 6 — DNA methylation GrimAge version 2 | Aging