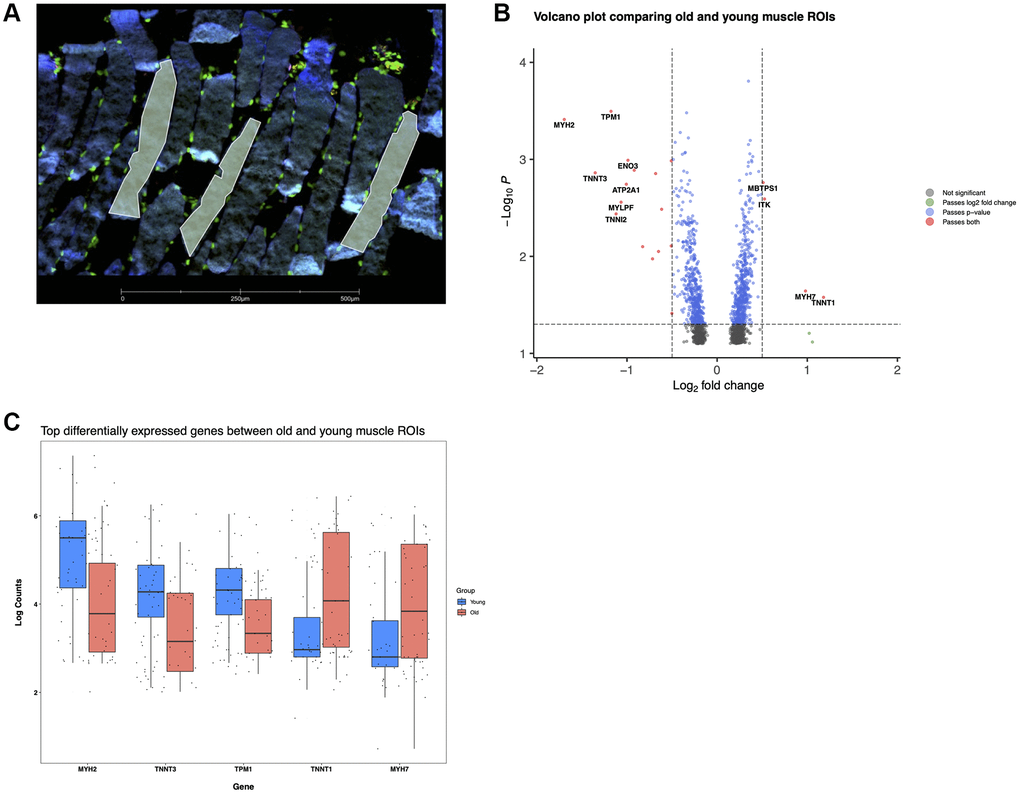
Figure 6.Reorganization of muscle fibers with age revealed by spatial transcriptomics. (A) Young muscle fibers, several ROls are shown in yellow delineating individual sections of distinct fibers. Desmin (blue), Syto83 (green), aSMA (yellow), CD68 (red). (B) Differentially expressed genes in old versus young spatial profiled muscle. (C) log (counts) of top differentially expressed genes.