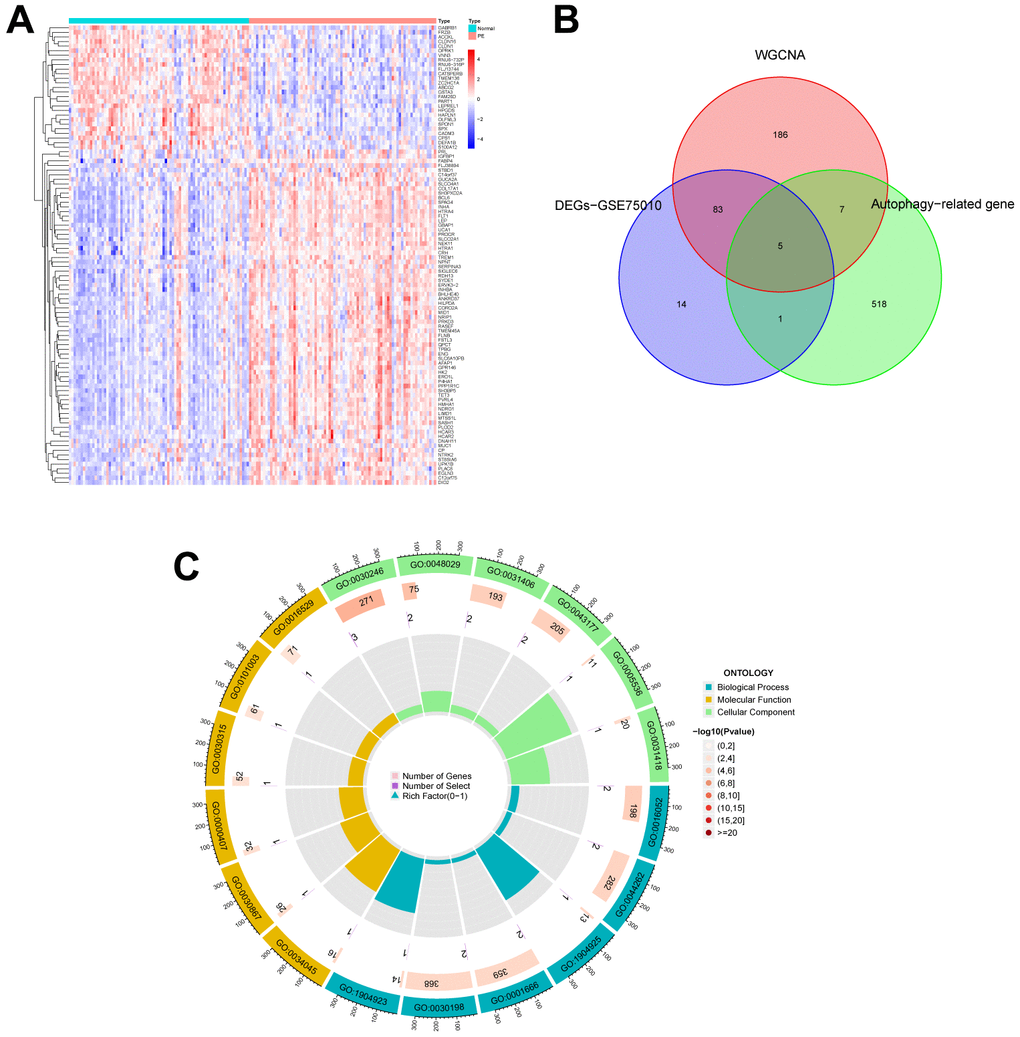
Figure 3.Identification of autophagy genes among key modules and DEGs, and enrichment analysis. (A) Heatmap plot of the DEGs in GSE75010. Blue represents down-regulation, red represents up-regulation, and the darker the color in the heatmap, the higher the significance. (B) Venn plot exhibiting the autophagy genes among key modules and DEGs, including HK2, PLOD2, TREM1, STBD1, and HAPLN1. (C) GO enrichment analysis of autophagy genes among key modules and DEGs. DEGs, differentially expressed genes. GO, gene ontology.