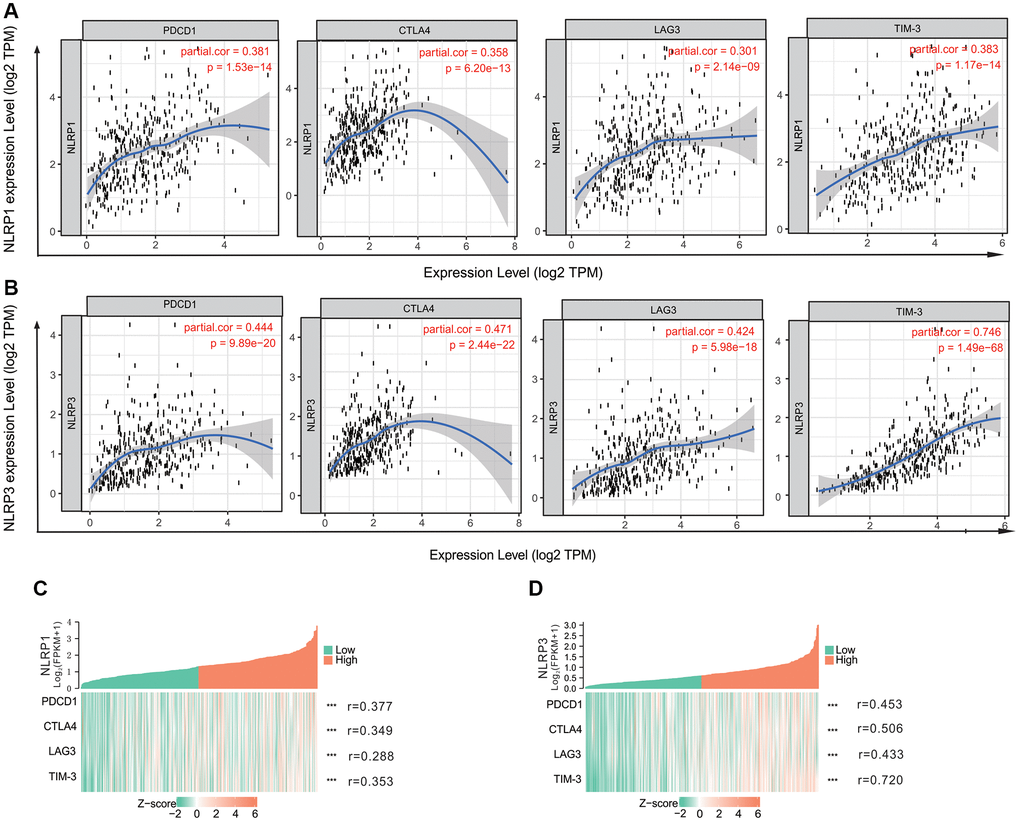
Figure 6.The correlation of NLRP1/NLRP3 with immune checkpoints in TIMER 2.0. (A) The expression scatterplots between NLRP1 and immune checkpoint genes (PCD1, r = 0.381, p = 1.53 × 10⁻¹⁴; CTLA4, r = 0.358, p = 6.20 × 10⁻¹³; LAG3, r = 0.301, p = 2.14 × 10⁻⁹; and TIM-3 r = 0.383, p = 1.17 × 10⁻¹⁴); (B) The expression scatterplots between NLRP3 and immune checkpoint genes (PCD1, r = 0.444, p = 9.89 × 10⁻²⁰; CTLA4, r = 0.471, p = 2.44 × 10⁻²²; LAG3, r = 0.424, p = 5.98 × 10⁻¹⁸; and TIM-3 r = 0.746, p = 1.49 × 10−68). (C) The single-gene co-expression heat map of NLRP1 and immune checkpoint genes (PCD1, r = 0.377, p < 0.001); CTLA4, r = 0.349, p < 0.001; LAG3, r = 0.288, p < 0.001; and TIM-3 r = 0.353, p < 0.001); (D) The single-gene co-expression heat map of NLRP3 and immune checkpoint genes (PCD1, r = 0.453, p < 0.001); CTLA4, r = 0.506, p < 0.001; LAG3, r = 0.433, p < 0.001; and TIM-3, r = 0.720, p < 0.001).