


Introduction
Gastric cancer (GC) is the third-leading cause of cancer-related death worldwide [1]. According to the latest Global Burden of Cancer data for 2020, China had 478,000 new cases of GC in 2020, accounting for 43.9% of new cases worldwide, and 373,000 GC-related deaths, accounting for 48.5% of global deaths [2]. Despite improvements in detection techniques and cancer-related treatments, most patients already have late-stage GC at the time of diagnosis, and the lack of screening techniques hampers early diagnosis, leading to a poor 5-year survival rate [3]. To improve the screening and diagnostic rate for GC, there is a need for accurate and sensitive biomarkers.
Immunotherapy has made great strides in the past decade. Unlike targeting the tumor itself, immunotherapy aims to overcome immune suppression caused by the tumor microenvironment, enabling the innate immune system to target and kill cancer cells [4]. Immunotherapy based on immune checkpoint inhibitors has led tumor therapy into a new era [5, 6]. However, identifying predictive biomarkers is necessary for achieving precise tumor immunotherapy [7].
Nucleotide-binding domain and leucine-rich repeat pyrin-domain-containing protein (NLRP) forms the inflammasome, which can play crucial roles in innate immunity and inflammation [8]. As an inflammatory-response sensor signaling protein, NLRP mediates the activation of caspases to induce cytokine maturation and pyroptosis [9]. Different NLRP members are expressed in different organ tissues and are involved in various cancers, regulating innate and adaptive immune responses, cell death, and cell proliferation via different pathways [10]. NLRP1 and NLRP3 are the most important components of inflammasomes and involved in distinct regulatory mechanisms [9]. Some cytokines, such as IL-1β precursor, depends on the activation of cytoplasmic caspase hydrolases, which are activated by NLRP inflammasomes, particularly NLRP1 and NLRP3 [11]. NLRP3 activates caspases through the adaptor protein ASC and promotes IL-1β and IL-18 secretion, whereas NLRP1 possesses a caspase recruitment domain, can directly bind to caspase proteins, and does not require ASC for transconjugation [8].
The multiple effects of NLRP1 and NLRP3 are closely related to various human diseases associated with dysfunctional immunoregulation, including autoimmune diseases [12], asthma [13], psoriasis [14], lupus nephritis [15], and Alzheimer’s disease [16], and have also been reported to play crucial roles in tumor progression, prognosis, and treatment response [17–19]. However, due to the tissue-dependent or cell-dependent roles of inflammasomes in tumorigenesis, the expression levels of inflammasome-related genes vary, and these genes play various roles in different cancers [20]. Inflammasome components can prevent tumor development or promote tumor development in some types of cancers [21, 22]. For example, activation of NLRP3 can promote tumor progression and metastasis in breast cancer [23, 24], and the NLRP3 inflammasome can induce cell proliferation, invasion, and tumor development in GC cells [25, 26]. However, NLRP3 functions as a tumor suppressor and protects against colitis-associated cancer [27]. Furthermore, NLRP3 also promotes the anticancer activity of natural killer cells and inhibits liver metastasis in colorectal cancer [28]. Considering the potentially important role of inflammasomes in tumorigenesis and immune regulation and functional differences among inflammasome family members, it is necessary to analyze the relationships between different inflammasomes and specific tumors. However, there have been no studies on the relationships of the NLRP1/NLRP3 inflammasome with prognosis and immune infiltration in GC.
Therefore, in this study, we analyzed the correlations between NLRP1/NLRP3 and prognosis in patients with GC using experimental data and public databases, such as Oncomine, Tumor Immune Estimate Resource (TIMER), The Cancer Genome Atlas (TCGA), and Kaplan-Meier Plotter. In addition, we also investigated the correlation of NLRP1/NLRP3 expression levels with clinicopathological characteristics and infiltrating immune cells. Gene set enrichment analysis (GSEA) was conducted to explore the immune-related pathways in which NLRP1/NLRP3 may participate during the regulation of GC. Overall, our findings provided preliminary evidence of an association between NLRP1/NLRP3 and immune cell infiltration in GC and afforded insights into the mechanisms through which NLRP1 and NLRP3 regulate this process.
Methods
Analysis of NLRP1/NLRP3 mRNA expression
The differential expression of NLRP1/NLRP3 mRNA in various tumors and normal tissues was analyzed using the Oncomine and TIMER databases. Oncomine is a platform for cancer gene information mining, based on a cancer gene chip database. TIMER is a comprehensive platform for tumor-infiltrating immune cell analysis in 32 cancer types (https://cistrome.shinyapps.io/timer/). The Diff Exp module in TIMER was used to analyze differential gene expression. In Oncomine, we selected data showing 1.5-fold changes in expression and a p value of less than 0.05 for differences in mRNA levels. NLRP1/NLRP3 differential expression in primary gastric cancer and tumor was evaluated by using TCGA data in UALCAN (http://ualcan.path.uab.edu/index.html).
Immunohistochemistry
We collected 20 cases of primary GC and corresponding adjacent normal tissue samples and performed immunohistochemical staining. Briefly, GC sections were incubated with monoclonal antibodies against NLRP1/NLRP3 (all from Abcam Company, Cambridge, UK) at a 1:100 dilution overnight at 4°C. The sections were conjugated with horseradish peroxidase-conjugated antibodies (Abcam) at a 1:500 dilution for 2 h at room temperature. Then 3,3-diaminobenzidine was added. The slides were mounted with Vectashield mounting medium. Light microscopy (Olympus) was used to observe the samples. Immunohistochemical scores were determined independently by two pathologists as previously described [29]. The experimental samples were collected from September to December 2021 in the Oncology Department of Changshu Second People's Hospital (Supplementary Table 1).
Western blot analysis
Protein was extracted from all tissue samples, and western blotting was carried out according to the methods previously reported in our laboratory [30]. β-Actin was used as a loading control and was detected using specific antibodies (1:1000; Abcam). The other primary antibodies used in this study were rabbit anti-NLRP1 (1:1000; Abcam) and rabbit anti-NLRP3 (1:500; Abcam), and the secondary antibodies were goat anti-rabbit IgG/HRP (1:1000; Sanjian, China). The data were obtained using Quantity One 4.62 software. Three independent experiments were conducted, and all data are represented as means ± standard deviations. Results with P values less than 0.05 were considered statistically significant. Statistical analyses and graphs were acquired using GraphPad Prism 8.0 software.
Prognosis and clinical characteristics analysis
The correlations of NLRP1/NLRP3 expression levels with survival and clinical characteristics in patients with GC were analyzed using Kaplan-Meier Plotter (n = 875) (http://www.kmplot.com) and TCGA (n = 392) databases. Kaplan-Meier analysis results are presented as survival curves and tables with hazard ratios (HRs) and log-rank P values. The results of TCGA analysis were presented as survival curves and bar charts. Results with a p value less than 0.05 were regarded as having statistical significance.
Immune cell infiltration and co-expression analysis
The Gene and Correlation Modules in the TIMER database were used to analyze the correlations of NLRP1/NLRP3 expression with the abundances of six types of tumor-infiltrating immune cell types and the expression levels of 58 immune cell markers [31, 32]. Stomach adenocarcinoma (STAD) RNAseq data from TCGA were used for co-expression correlation analysis between NLRP1/NLRP3 and immune checkpoint genes. Data were analyzed using the graphical visualization software package GGploT2 version 3.3.3 (https://ggplot2.tidyverse.org/). Spearman’s correlation analysis was used to evaluate correlations with gene expression. The strength of the correlation was considered to be significantly positive when the correlation coefficient was greater than 0.3 and the p value was less than 0.01.
GSEA
RNA-seq fpkm data from STAD in TCGA were downloaded from the UCSC Xena site (https://xena.ucsc.edu/). STAD patients were divided into a high-expression group and a low-expression group according to the median NLRP1/NLRP3 expression level. Then, GSEA_4.1.0 software [33] was used for single-gene GSEA analysis. All items were listed in descending order of standardized enrichment score (NES), and the top 10 items related to tumor immunity were listed as the analysis results from the high-expression group; the top 5 items are plotted. Items with a nominal p value less than 0.01, false discovery rate q-value less than 0.01, and NES greater than 2.0 were regard as significantly enriched.
Availability of data and material
All datasets generated for this study are included in the article.
Results
Expression of NLRP1/NLRP3 in public databases and clinical cases
Different inflammasome members may play distinct roles in tumorigenesis [20]. To explore the correlations between NLRP1/NLRP3 and tumorigenesis, we analyzed NLRP1/NLRP3 expression differences between various tumors and corresponding normal tissues based on chip data in Oncomine and RNA-seq data in TIMER database. As shown in Figure 1A, NLRP1/NLRP3 expression was varied among datasets for the same tumor type. There were three GC datasets in Oncomine; NLRP1 was upregulated in one dataset and downregulated in one dataset, whereas one dataset showed no difference in NLRP3 expression between tumor and normal tissues (Figure 1A). TIMER analysis showed that NLRP1 and NLRP3 were both downregulated in six tumor tissues types, including bladder urothelial carcinoma (BLCA), breast invasive carcinoma (BRCA), colon adenocarcinoma (COAD), lung adenocarcinoma (LUAD), lung squamous cell carcinoma) (LUSC), and rectum adenocarcinoma (READ), and were both upregulated in tumor tissues of kidney renal clear cell carcinoma (KIRC) and stomach adenocarcinoma (STAD), as compared with corresponding normal tissues (Figure 1B and 1D). UALCAN analysis of TCGA data showed that NLRP1/NLRP3 expression level in primary gastric cancer was significantly higher than normal tissues (Figure 1C and 1E, **p < 0.01, ***p < 0.001).
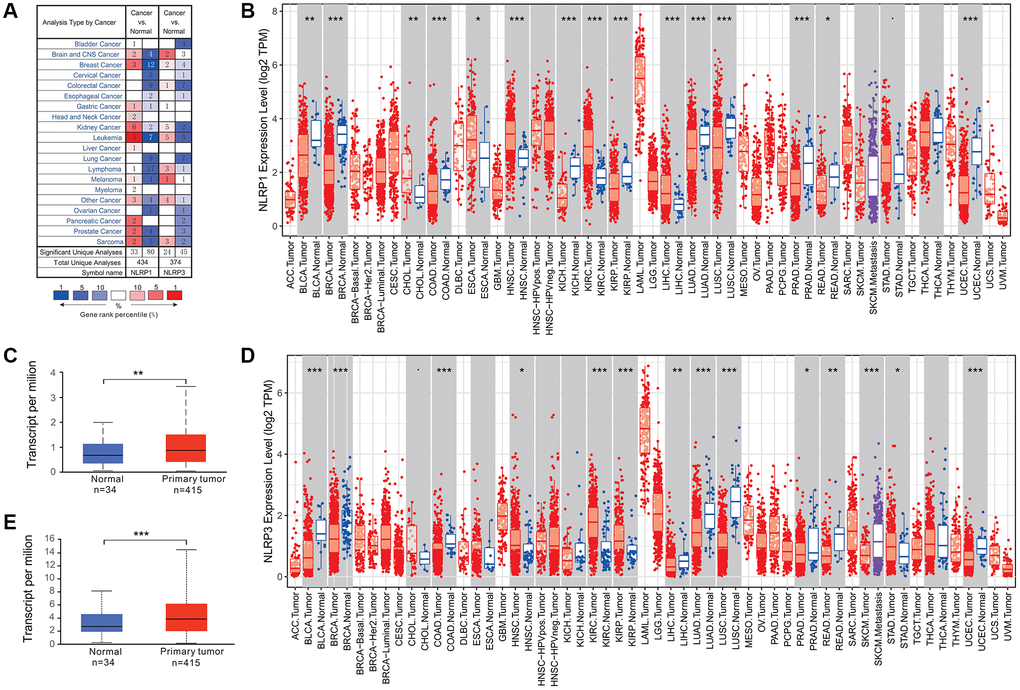
Figure 1. NLRP1/NLRP3 expression levels in various types of human cancers. (A) NLRP1/NLRP3 expression in data sets of different cancers compared with normal tissues in the Oncomine database. (B and C) NLRP1/NLRP3 expression levels in various types of cancers were determined by TIMER 2.0. (D and E) NLRP1/NLRP3 expression levels in primary gastric cancer and normal tissues from TCGA data by UALCAN (*p < 0.05, **p < 0.01, ***p < 0.001).
To evaluate the expression of NLRP1/NLRP3 protein in GC, we performed immunohistochemical and western blot analysis using 20 paired clinical tissue samples of primary GC. The results showed that NLRP1 and NLRP3 were highly expressed in GC tissues as compared with those in adjacent normal tissues (Figure 2A–2E, p < 0.05). Considering both our database analysis and experimental results, we concluded that high expression of NLRP1/NLRP3 may promote the occurrence of GC.
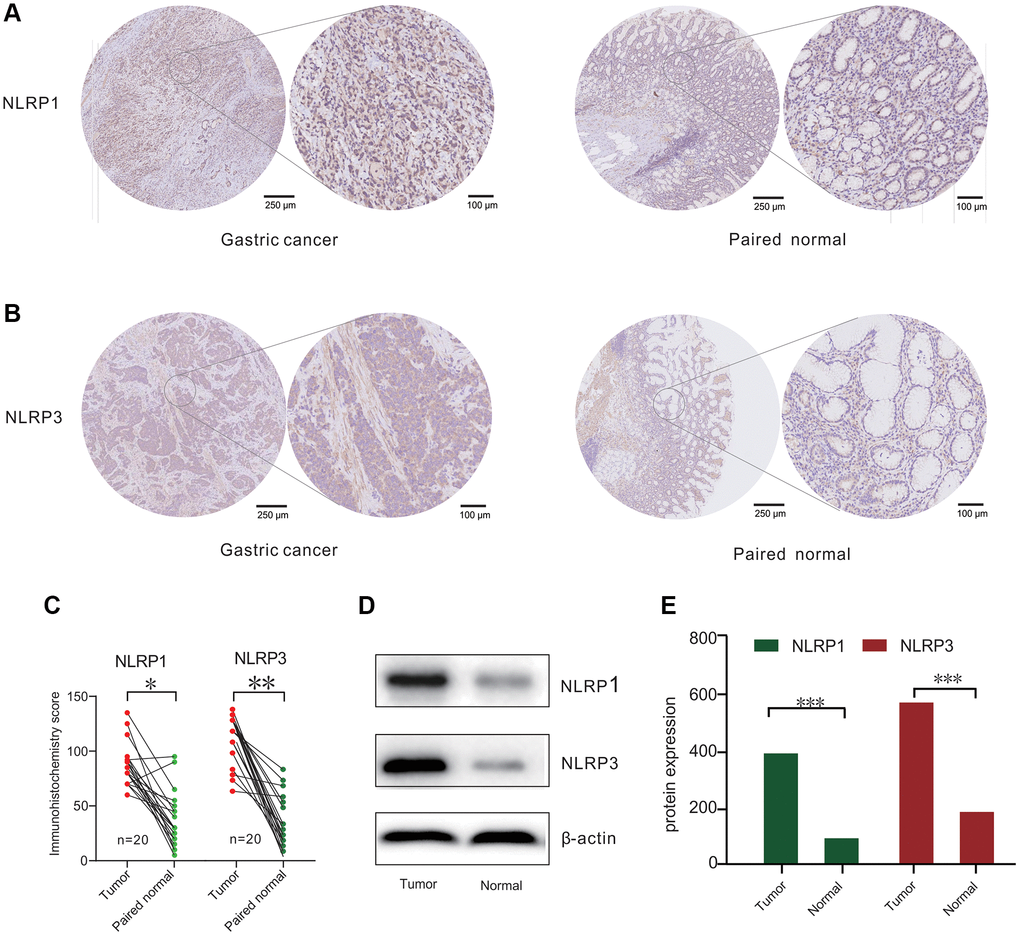
Figure 2. NLRP1/NLRP3 protein differently expressed in patients with gastric cancer (GC). (A and B) Representative Immunohisto-chemistry (IHC) staining for NLRP1 and NLRP3 from 20 gastric tissue and paired normal tissue. (C) IHC analysis for NLRP1/NLRP3 protein levels in 20 paired GC cases. (D) Representative Western blotting results of NLRP1/NLRP3 in 20 GC cases. (E) Histogram of NLRP1/NLRP3 protein expression level from 20 GC cases (*p < 0.05, **p < 0.01, ***p < 0.001).
Potential clinical prognostic value of NLRP1/NLRP3 in GC
Survival analysis was performed to investigate the clinical prognostic potential of NLRP1/NLRP3 in GC. Kaplan-Meier survival analysis of 875 patients with GC revealed that patients with high NLRP1/NLRP3 expression had worse overall survival (OS), first-progression survival (FPS), and post-progression survival (PPS); (Figure 3A–3C; NLRP1: OS, HR = 1.77, p = 2.3 × 10⁻¹⁰; FPS, HR = 1.76, p = 8.1 × 10⁻⁸; PPS, HR = 2.73, p = 1 × 10⁻¹⁶; Figure 3D–3F; NLRP3: OS, HR = 1.54, p = 1.1 × 10⁻⁶; FPS, HR = 1.59, p = 2.7 × 10⁻⁵; PPS, HR = 2.04, p = 1.9 × 10⁻⁹), suggesting that high expression of NLRP1/NLRP3 may be related to reduced survival in patients with GC. To validate the above results based on microarray data, we used TCGA RNA-seq data and performed survival analysis in 392 patients with GC. The results showed that patients with high NLRP1/NLRP3 expression had reduced 10-year survival rates (Figure 3G; NLRP1: p = 0.28; Figure 3H; NLRP3: p = 0.037). From this analysis, we inferred that high NLRP1/NLRP3 expression, particularly high NLRP3 expression, was associated with poor outcomes in patients with GC.
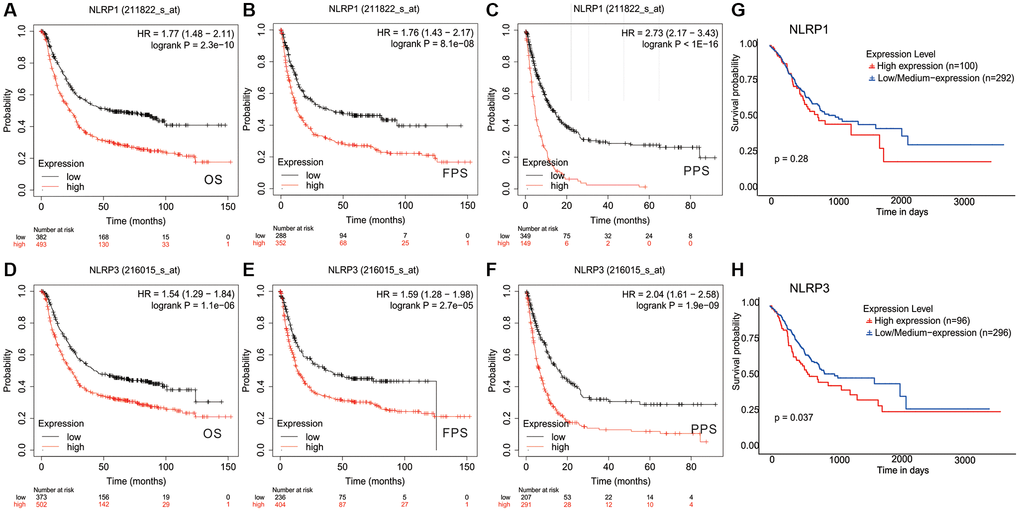
Figure 3. Kaplan-Meier survival curves comparing the high and low expression of NLRP1/NLRP3 in gastric cancer. In the Kaplan-Meier plotter database, (A–C) high NLRP1 expression was correlated with poor OS (n = 875, HR = 1.77, p = 2.3e-10), FPS (n = 640, HR = 1.76, p = 8.1e-08), and PPS (n = 498, HR = 2.73, p = 1e-16); (D–F) high NLRP3 expression was correlated with bad OS(n = 875, HR = 1.54, p = 1.1e-06), PFS (n = 640, HR = 1.59, p = 2.71e-05), and PPS (n = 498, HR = 2.04, p = 1.9e-09). (G and H) In TCGA data, High NLRP1/NLRP3 expression was associated with lower 10-year survival (n = 392, NLRP1 p = 0.28; NLRP3 p = 0.037).
Correlation of NLRP1/NLRP3 with the clinicopathological characteristics of GC
We further analyzed the correlation between NLRP1/NLRP3 expression level and different clinicopathological characteristics in 875 patients with GC from Kaplan-Meier Plotter database (Table 1). The expression levels of NLRP1/NLRP3 were significantly correlated with tumor stage and degree in patients with GC (Table 1, Figure 4). Specifically, high expression of NLRP1 was significantly correlated with poor OS in patients with stages 1–3 cancer (Table 1; p = 0.048, p = 0.004, p = 0.0002), whereas high expression of NLRP3 was only correlated with poor outcome in patients with stage 3 GC (OS, p = 0.0003; FPS, p = 0.021). High expression of NLRP1 and NLRP3 was significantly correlated with reduced OS in patients with stages T2–3 GC (Figure 4A–4D, p < 0.05) and stages N1–3 GC (Figure 4E–4H, p < 0.01). TCGA data analysis showed similar results. Overall, high NLRP1/NLRP3 expression levels had a more significant correlation with higher tumor grade, cancer stage and more axillary lymph nodes metastases (Figure 4I–4N). These findings suggested that NLRP1 and NLRP3 may play similar roles in the progression of GC, and high NLRP1/NLRP3 expression may be a potential risk factor for the invasion and metastasis of GC in vivo, thereby contributing to poor prognosis.
Table 1. Association between NLRP1/NLRP3 expression level and clinicopathological characteristics in patients with gastric cancer by Kaplan-Meier plotter.
| Overall survival | First progression survival | ||||||||||||||||||||||||||||||||||||||||||||||||||||||||||||||||||||||||||||||||||||||||||||||||||
| N | NLRP1 | NLRP3 | N | NLRP1 | NLRP3 | ||||||||||||||||||||||||||||||||||||||||||||||||||||||||||||||||||||||||||||||||||||||||||||||
| Hazard ratio | P-value | Hazard ratio | P-value | Hazard ratio | P-value | Hazard ratio | P-value | ||||||||||||||||||||||||||||||||||||||||||||||||||||||||||||||||||||||||||||||||||||||||||||
| SEX | |||||||||||||||||||||||||||||||||||||||||||||||||||||||||||||||||||||||||||||||||||||||||||||||||||
| Female | 236 | 2.03 (1.43−2.89) | 5.6e−05 | 1.59 (1.20–2.29) | 0.012 | 201 | 1.95 (1.31−2.9) | 0.00075 | 1.49 (1.02−2.19) | 0.037 | |||||||||||||||||||||||||||||||||||||||||||||||||||||||||||||||||||||||||||||||||||||||||
| Male | 544 | 1.88 (1.50−2.35) | 1.5e−08 | 1.92 (1.49–2.49) | 3.9e−07 | 437 | 1.81 (1.41−2.33) | 2e−06 | 1.74 (1.34−2.27) | 3.3e−05 | |||||||||||||||||||||||||||||||||||||||||||||||||||||||||||||||||||||||||||||||||||||||||
| STAGE | |||||||||||||||||||||||||||||||||||||||||||||||||||||||||||||||||||||||||||||||||||||||||||||||||||
| 1 | 67 | 2.64 (0.97−7.18) | 0.048 | 1.97 (0.71–5.47) | 0.19 | 60 | 0.44 (0.13−1.52) | 0.18 | 0.58 (0.18−1.89) | 0.36 | |||||||||||||||||||||||||||||||||||||||||||||||||||||||||||||||||||||||||||||||||||||||||
| 2 | 140 | 2.35 (1.29−4.28) | 0.0041 | 1.30 (0.69–2.45) | 0.41 | 131 | 1.71 (0.93−3.12) | 0.081 | 0.64 (0.33−1.25) | 0.19 | |||||||||||||||||||||||||||||||||||||||||||||||||||||||||||||||||||||||||||||||||||||||||
| 3 | 305 | 1.72 (1.29−2.29) | 0.00018 | 1.86 (1.32–2.62) | 0.00034 | 186 | 2.05 (1.29−3.24) | 0.0018 | 1.56 (1.07−2.29) | 0.021 | |||||||||||||||||||||||||||||||||||||||||||||||||||||||||||||||||||||||||||||||||||||||||
| 4 | 148 | 1.35 (0.88−2.06) | 0.16 | 1.31 (0.9−1.92) | 0.16 | 141 | 0.83 (0.57−1.22) | 0.34 | 1.31 (0.89−1.92) | 0.17 | |||||||||||||||||||||||||||||||||||||||||||||||||||||||||||||||||||||||||||||||||||||||||
| STAGE T | |||||||||||||||||||||||||||||||||||||||||||||||||||||||||||||||||||||||||||||||||||||||||||||||||||
| 2 | 241 | 1.85 (1.21−2.82) | 0.0039 | 1.79 (1.14−2.83) | 0.011 | 239 | 1.72 (1.14−2.59) | 0.0093 | 1.66 (1.06−2.6) | 0.026 | |||||||||||||||||||||||||||||||||||||||||||||||||||||||||||||||||||||||||||||||||||||||||
| 3 | 204 | 1.46 (1.03−2.06) | 0.031 | 1.57 (1.1−2.24) | 0.012 | 204 | 1.27 (0.91−1.77) | 0.16 | 1.45 (1.03−2.05) | 0.034 | |||||||||||||||||||||||||||||||||||||||||||||||||||||||||||||||||||||||||||||||||||||||||
| 4 | 38 | 1.32 (0.54−3.23) | 0.53 | 1.32 (0.54−3.23) | 0.53 | 39 | 1.43 (0.62−3.28) | 0.4 | 2.09 (0.97−4.49) | 0.055 | |||||||||||||||||||||||||||||||||||||||||||||||||||||||||||||||||||||||||||||||||||||||||
| STAGE N | |||||||||||||||||||||||||||||||||||||||||||||||||||||||||||||||||||||||||||||||||||||||||||||||||||
| 0 | 74 | 2.05 (0.82−5.1) | 0.12 | 0.49 (0.2−1.19) | 0.11 | 72 | 2.12 (0.86−5.24) | 0.096 | 0.58 (0.24−1.38) | 0.22 | |||||||||||||||||||||||||||||||||||||||||||||||||||||||||||||||||||||||||||||||||||||||||
| 1 | 225 | 2.23 (1.48−3.36) | 8.5e−05 | 1.31 (0.86−1.98) | 0.21 | 222 | 1.87 (1.27−2.77) | 0.0014 | 1.23 (0.82−1.83) | 0.31 | |||||||||||||||||||||||||||||||||||||||||||||||||||||||||||||||||||||||||||||||||||||||||
| 2 | 121 | 2.05 (1.27−3.32) | 0.0028 | 2.39 (1.35−4.25) | 0.0021 | 125 | 1.83 (1.15−2.92) | 0.01 | 2.22 (1.28−3.85) | 0.0034 | |||||||||||||||||||||||||||||||||||||||||||||||||||||||||||||||||||||||||||||||||||||||||
| 3 | 76 | 1.54 (0.88−2.72) | 0.13 | 1.89 (1.07−3.32) | 0.026 | 76 | 1.35 (0.77−2.36) | 0.29 | 1.81 (1.02−3.2) | 0.039 | |||||||||||||||||||||||||||||||||||||||||||||||||||||||||||||||||||||||||||||||||||||||||
| 123 | 422 | 1.62 (1.24−2.11) | 0.00036 | 1.48 (1.13−1.93) | 0.0039 | 423 | 1.76 (1.27−2.43) | 5e−04 | 1.36 (1.05−1.76) | 0.019 | |||||||||||||||||||||||||||||||||||||||||||||||||||||||||||||||||||||||||||||||||||||||||
| STAGE M | |||||||||||||||||||||||||||||||||||||||||||||||||||||||||||||||||||||||||||||||||||||||||||||||||||
| 0 | 444 | 1.64 (1.24−2.18) | 0.00046 | 1.54 (1.1−2.16) | 0.011 | 443 | 1.69 (1.23−2.33) | 0.001 | 1.47 (1.06−2.04) | 0.02 | |||||||||||||||||||||||||||||||||||||||||||||||||||||||||||||||||||||||||||||||||||||||||
| 1 | 56 | 1.52 (0.79−2.92) | 0.21 | 1.89 (1.01−3.54) | 0.042 | 56 | 0.74 (0.39−1.41) | 0.35 | 0.61 (0.33−1.15) | 0.12 | |||||||||||||||||||||||||||||||||||||||||||||||||||||||||||||||||||||||||||||||||||||||||
| DIFFERRATION | |||||||||||||||||||||||||||||||||||||||||||||||||||||||||||||||||||||||||||||||||||||||||||||||||||
| POOR | 165 | 1.37 (0.89−2.11) | 0.15 | 1.59 (1.05−2.39) | 0.025 | 121 | 1.5 (0.94−2.4) | 0.088 | 0.82 (0.52−1.29) | 0.39 | |||||||||||||||||||||||||||||||||||||||||||||||||||||||||||||||||||||||||||||||||||||||||
| MODERATE | 67 | 1.86 (0.81−4.24) | 0.14 | 0.56 (0.28−1.1) | 0.089 | 67 | 1.71 (0.79−3.72) | 0.17 | 0.64 (0.33−1.22) | 0.17 | |||||||||||||||||||||||||||||||||||||||||||||||||||||||||||||||||||||||||||||||||||||||||
| WELL | 32 | 7.47 (1.72−32.41) | 0.0017 | 2.45 (0.82−7.32) | 0.098 | 5 | NA | NA | |||||||||||||||||||||||||||||||||||||||||||||||||||||||||||||||||||||||||||||||||||||||||||
| Note: T represents the size and invasion of the tumor; T1 indicates that the tumor is confined to the mucosa and submucosa; T2 indicates that the tumor is infiltrated into the muscle layer; T3 indicates that the tumor is infiltrated into the subserous membrane; T4 represents the tumor infiltrating through the serosal layer. N0 indicates no local lymph node metastasis; N1-N3 indicates local lymph node metastasis. M0 means no distant organ metastasis; M1 means distant organ metastasis of gastric cancer. | |||||||||||||||||||||||||||||||||||||||||||||||||||||||||||||||||||||||||||||||||||||||||||||||||||
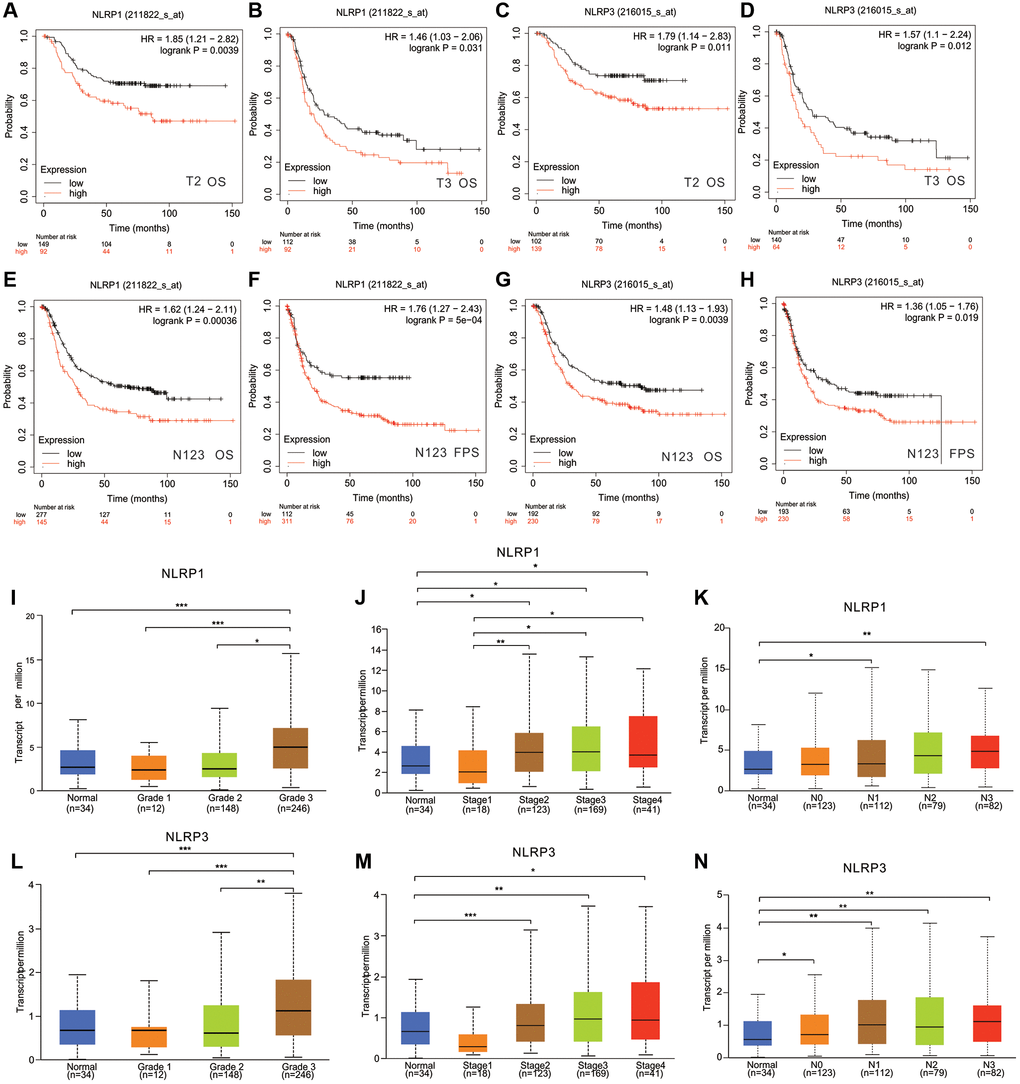
Figure 4. The relationship between NLRP1/NLRP3 expression levels with clinical characteristics of patients with GC. In Kaplan Meier Plotter, high expression of NLRP1 was correlated with worse prognosis of GC patients in (A) Stage T2 (n = 241, OS, HR = 1.85, p = 0.0039), (B) Stage T3 (n = 204, OS HR = 1.461, p = 0.031). High expression of NLRP3 was correlated with worse prognosis of GC patients in (C) stage T2 (n = 241, OS, HR = 1.79, p = 0.011), (D) Stage T3 (n = 204, OS, HR = 1.57, p = 0.012). High expression of NLRP1 was correlated with worse prognosis of GC patients in (E, F) Stages N1+2+3 (n = 422, OS, HR = 1.62, p = 0.00036; PFS, HR = 1.76, p = 5e−04). High expression of NLRP3 was correlated with worse prognosis of GC patients in (G, H) Stages N1+2+3 (n = 422, OS, HR = 1.48, p = 0.0039; PFS, HR = 1.36, p = 0.019). (I–N) In TCGA, Expression level of NLRP1/NLRP3 has a significant correlation with tumor grade, cancer stage, and lymph node metastasis. *p < 0.05, **p < 0.01. Notes: Grade 1, Well differentiated (low grade); Grade 2, Moderately differentiated (intermediate grade); Grade 3, Poorly differentiated (high grade); Grade 4, Undifferentiated (high grade). N0, No regional lymph node metastasis; N1, Metastases in 1 to 3 axillary lymph nodes; N2, Metastases in 4 to 9 axillary lymph nodes; N3, Metastases in 10 or more axillary lymph nodes.
Association of the immune cell infiltration with NLRP1/NLRP3 expression and prognosis of GC
The tumor microenvironment contains various infiltrating immune cells, which may affect patient prognosis [34]. Analysis of immune infiltrates in TIMER showed that NLRP1/NLRP3 expression levels were significantly negatively correlated with tumor purity and positively correlated with multiple infiltrating immune cells in STAD. Additionally, NLRP1 expression levels were significantly positively correlated with infiltrating levels of all six types of immune cells (all p < 0.001; Figure 5A). NLRP3 expression levels were significantly positively correlated with infiltrating levels of all immune cell types (all p < 0.001), except B cells, which were negatively correlated (r = −0.16, p = 0.002; Figure 5B). NLRP3 showed stronger correlations with CD8+ T cell, macrophages, neutrophils, and dendritic cells (all r > 0.4, p < 0.001) than did NLRP1. NLRP1 expression was positively correlated with B cell abundance, whereas NLRP3 expression was negatively correlated with B cell abundance. Additionally, STAD patients with high infiltration level of macrophages had a significant reduced survival (p = 0.004) (Figure 5C).
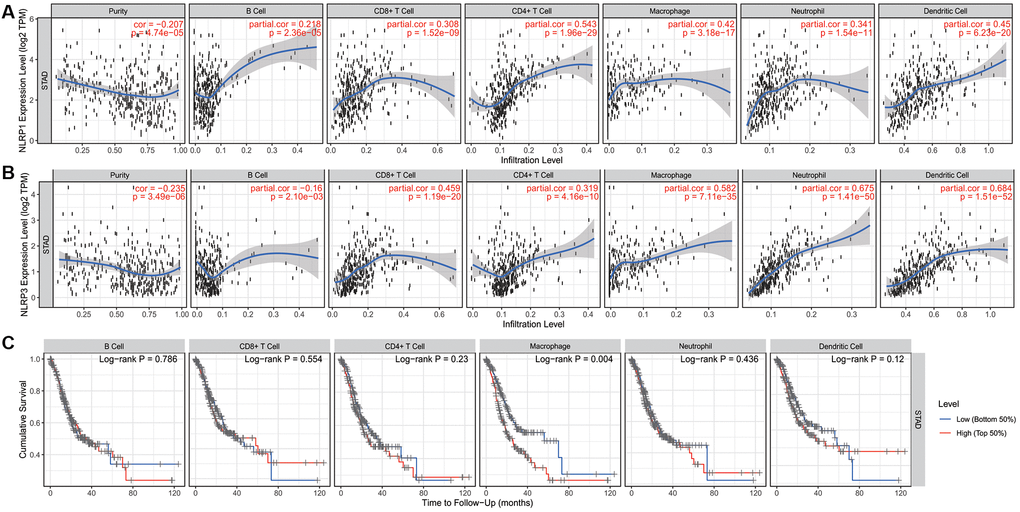
Figure 5. The correlation of infiltration levels of six types of immune cell types with NLRP1/NLRP3 expression levels and survival in STAD (n = 415) in TIMER 2.0. (A) NLRP1 expression level is significantly negatively related to tumor purity and has a significantly positive correlation with the abundance of all 6 types of immune cells in STAD (all p < 0.001). (B) NLRP3 expression is significantly negatively related to tumor purity and has a significant positive correlation with 5 types of immune cells (CD8+ T cells, CD4+ T cells, macrophages, neutrophils, and dendritic cells, other than B cells) in STAD (p < 0.001). (C) In six types of immune cell, the infiltration level of macrophage was significantly correlated with the cumulative survival of patients of STAD (p = 0.004).
These results suggested that NLRP1/NLRP3 was associated with immune cell infiltration and high expression levels may promote tumor immune cell infiltration and leads to a poor prognosis. Moreover, NLRP1 and NLRP3 may play similar but not identical roles in immune-regulation in STAD.
Relationships of NLRP1/NLRP3 with immune cell markers
We assessed correlations of NLRP1/NLRP3 expression with 57 immune cell markers in STAD to explore the potential mechanisms through which NLRP1/NLRP3 modulate immune cell infiltration. NLRP1/NLRP3 expression levels were positively correlated with the vast majority of marker sets of various immune cells in STAD (Tables 2 and 3). NLRP1 was significantly positively correlated with the marker sets of T cells, B cells, regulatory T cells (Tregs), and M2 macrophages. As compared with NLRP1, NLRP3 had stronger positive correlations with a broader variety of immune cell markers. Specifically, for innate immune cells, NLRP3 expression was significantly positively correlated with almost all markers of monocytes, tumor-associated macrophages (TAMs), M2 macrophages, neutrophils, and dendritic cells (all r > 0.5, p < 0.0001). For specific immune cells, NLRP3 was significantly positively correlated with most markers of T cells, Tfh cells, Th1 cells, Th2 cells, Th17 cells, Tregs, and T-cell exhaustion, particularly with markers of T cell exhaustion (programmed cell death-1 [PD-1], cytotoxic T-lymphocyte antigen [CTLA] 4, lymphocyte activating 3 [LAG3], T cell immunoglobulin and mucin domain-containing protein 3 [TIM-3]; all r > 0.5, p < 0.0001) (Tables 3, Figure 6A and 6B), which are important immune checkpoints. The single-gene co-expression heat map showed similar results that the expression level of NLRP1/NLRP3 was significantly positively correlated with that of PD-1 (r = 0.453), CTLA4 (r = 0.506), LAG3 (r = 0.433), and TIM-3 (r = 0.720) (all p < 0.0001; Figure 6C and 6D). In addition, NLRP1 and NLRP3 expression had consistently weaker correlations with M1 macrophage marker sets, but consistently stronger correlations with marker sets of M2 macrophage, TAM, and Monocyte (Table 3, Figure 7A–7H), revealing that NLRP1/NLRP3 may induce TAM polarization towards M2 phenotype. All above results strongly suggested that NLRP1/NLRP3 may be involved in regulation of infiltration of immune cells in GC.
Table 2. Correlation analysis between NLRP1/NLRP3 and related genes and markers of innate immune cells in TIMER.
| Description | Genemarkers | NLRP1 | NLRP3 | ||||||||||||||||||||||||||||||||||||||||||||||||||||||||||||||||||||||||||||||||||||||||||||||||
| None | Purity | None | Purity | ||||||||||||||||||||||||||||||||||||||||||||||||||||||||||||||||||||||||||||||||||||||||||||||||
| Cor | P | Cor | P | Cor | P | Cor | P | ||||||||||||||||||||||||||||||||||||||||||||||||||||||||||||||||||||||||||||||||||||||||||||
| Monocyte | CD86 | 0.421 | 3.22e−19 | 0.392 | 2.20e−15 | 0.777 | 6.59e−85 | 0.774 | 8.40e−77 | ||||||||||||||||||||||||||||||||||||||||||||||||||||||||||||||||||||||||||||||||||||||||||
| CD115(CSF1R) | 0.471 | 0e+00 | 0.460 | 2.89e−21 | 0.826 | 6.49e−105 | 0.834 | 2.68e−99 | |||||||||||||||||||||||||||||||||||||||||||||||||||||||||||||||||||||||||||||||||||||||||||
| CD14 | 0.342 | 8.02e−13 | 0.309 | 7.52e−10 | 0.729 | 5.38E−70 | 0.719 | 1.40e−61 | |||||||||||||||||||||||||||||||||||||||||||||||||||||||||||||||||||||||||||||||||||||||||||
| TAM | CCL2 | 0.387 | 6.55e−17 | 0.360 | 5.20e−13 | 0.549 | 5.41e−34 | 0.519 | 1.62e−27 | ||||||||||||||||||||||||||||||||||||||||||||||||||||||||||||||||||||||||||||||||||||||||||
| CD68 | 0.217 | 8.88e−06 | 0.206 | 5.45e−05 | 0.581 | 7.39e−39 | 0.573 | 1.93e−34 | |||||||||||||||||||||||||||||||||||||||||||||||||||||||||||||||||||||||||||||||||||||||||||
| IL10 | 0.415 | 9.96e−19 | 0.386 | 6.27e−15 | 0.693 | 1.22e−60 | 0.666 | 5.69e−50 | |||||||||||||||||||||||||||||||||||||||||||||||||||||||||||||||||||||||||||||||||||||||||||
| M1 macrophage | INOS(NOS2) | −0.02 | 6.92e−01 | −0.032 | 5.38e−01 | 0.177 | 2.95e−04 | 0.159 | 1.85e−03 | ||||||||||||||||||||||||||||||||||||||||||||||||||||||||||||||||||||||||||||||||||||||||||
| IRF5 | 0.339 | 1.87e−12 | 0.324 | 1.02e−10 | 0.416 | 8.27e−19 | 0.421 | 1.13e−17 | |||||||||||||||||||||||||||||||||||||||||||||||||||||||||||||||||||||||||||||||||||||||||||
| COX2(PTGS2) | 0.061 | 2.16e−01 | 0.022 | 6.68e−01 | 0.286 | 2.79e−09 | 0.261 | 2.67e−07 | |||||||||||||||||||||||||||||||||||||||||||||||||||||||||||||||||||||||||||||||||||||||||||
| M2 macrophage | CD163 | 0.431 | 0e+00 | 0.417 | 2.30e−17 | 0.812 | 8.35e−99 | 0.813 | 9.57e−91 | ||||||||||||||||||||||||||||||||||||||||||||||||||||||||||||||||||||||||||||||||||||||||||
| VSIG4 | 0.34 | 1.42e−12 | 0.330 | 4.49e−11 | 0.697 | 1.16e−61 | 0.701 | 2.71e−57 | |||||||||||||||||||||||||||||||||||||||||||||||||||||||||||||||||||||||||||||||||||||||||||
| MS4A4A | 0.434 | 0e+00 | 0.416 | 2.81e−17 | 0.749 | 1.07e−75 | 0.747 | 7.11e−69 | |||||||||||||||||||||||||||||||||||||||||||||||||||||||||||||||||||||||||||||||||||||||||||
| Neutrophils | CD66b (CEACAM8) | 0.078 | 1.12e−01 | 0.072 | 1.62e−01 | 0.127 | 9.46e−03 | 0.140 | 6.42e−03 | ||||||||||||||||||||||||||||||||||||||||||||||||||||||||||||||||||||||||||||||||||||||||||
| CD11b (ITGAM) | 0.524 | 0e+00 | 0.515 | 4.83e−27 | 0.736 | 5.46e−72 | 0.729 | 6.02e−64 | |||||||||||||||||||||||||||||||||||||||||||||||||||||||||||||||||||||||||||||||||||||||||||
| CCR7 | 0.586 | 0e+00 | 0.567 | 1.33e−33 | 0.627 | 8.42e−47 | 0.608 | 1.03e−39 | |||||||||||||||||||||||||||||||||||||||||||||||||||||||||||||||||||||||||||||||||||||||||||
| Natural killer cell | KIR2DL1 | 0.257 | 1.14e−07 | 0.229 | 6.70e−06 | 0.334 | 2.79e−12 | 0.339 | 1.27e−11 | ||||||||||||||||||||||||||||||||||||||||||||||||||||||||||||||||||||||||||||||||||||||||||
| KIR2DL3 | 0.174 | 3.75e−04 | 0.145 | 4.76e−03 | 0.287 | 2.61e−09 | 0.278 | 3.61e−08 | |||||||||||||||||||||||||||||||||||||||||||||||||||||||||||||||||||||||||||||||||||||||||||
| KIR2DL4 | 0.158 | 1.21e−03 | 0.109 | 3.40e−02 | 0.257 | 1.09e−07 | 0.215 | 2.48e−05 | |||||||||||||||||||||||||||||||||||||||||||||||||||||||||||||||||||||||||||||||||||||||||||
| KIR3DL1 | 0.293 | 1.24e−09 | 0.274 | 6.06e−08 | 0.305 | 2.27e−10 | 0.298 | 3.13e−09 | |||||||||||||||||||||||||||||||||||||||||||||||||||||||||||||||||||||||||||||||||||||||||||
| KIR3DL2 | 0.252 | 2.01e−07 | 0.222 | 1.31e−05 | 0.325 | 1.24e−11 | 0.311 | 6.02e−10 | |||||||||||||||||||||||||||||||||||||||||||||||||||||||||||||||||||||||||||||||||||||||||||
| KIR3DL3 | −0.034 | 4.85e−01 | −0.043 | 4.09e−01 | 0.117 | 1.75e−02 | 0.137 | 7.56e−03 | |||||||||||||||||||||||||||||||||||||||||||||||||||||||||||||||||||||||||||||||||||||||||||
| KIR2DS4 | 0.195 | 6.53e−05 | 0.156 | 2.40e−03 | 0.240 | 7.25e−07 | 0.250 | 8.50e−07 | |||||||||||||||||||||||||||||||||||||||||||||||||||||||||||||||||||||||||||||||||||||||||||
| Dendritic cell | HLA-DPB1 | 0.418 | 0e+00 | 0.384 | 9.95e−15 | 0.578 | 2.07e−38 | 0.556 | 4.03e−32 | ||||||||||||||||||||||||||||||||||||||||||||||||||||||||||||||||||||||||||||||||||||||||||
| HLA-DQB1 | 0.298 | 7.59e−10 | 0.244 | 1.48e−06 | 0.418 | 5.77e−19 | 0.379 | 2.30e−14 | |||||||||||||||||||||||||||||||||||||||||||||||||||||||||||||||||||||||||||||||||||||||||||
| HLA-DRA | 0.362 | 3.82e−14 | 0.327 | 6.88e−11 | 0.573 | 1.47e−37 | 0.559 | 1.78e−32 | |||||||||||||||||||||||||||||||||||||||||||||||||||||||||||||||||||||||||||||||||||||||||||
| HLA-DPA1 | 0.352 | 2.11e−13 | 0.315 | 3.47e−10 | 0.569 | 5.12e−37 | 0.553 | 9.49e−32 | |||||||||||||||||||||||||||||||||||||||||||||||||||||||||||||||||||||||||||||||||||||||||||
| BDCA-1(CD1C) | 0.522 | 1.94e−30 | 0.514 | 6.48e−27 | 0.540 | 1.02e−32 | 0.504 | 8.43e−26 | |||||||||||||||||||||||||||||||||||||||||||||||||||||||||||||||||||||||||||||||||||||||||||
| BDCA-4(NRP1) | 0.515 | 0e+00 | 0.499 | 2.88e−25 | 0.700 | 2.22e−62 | 0.690 | 9.06e−55 | |||||||||||||||||||||||||||||||||||||||||||||||||||||||||||||||||||||||||||||||||||||||||||
| CD11c (ITGAX) | 0.487 | 0e+00 | 0.471 | 2.46e−22 | 0.810 | 1.22e−97 | 0.802 | 1.61e−86 | |||||||||||||||||||||||||||||||||||||||||||||||||||||||||||||||||||||||||||||||||||||||||||
| Abbreviations: Cor: R value of Spearman’s correlation; None: correlation without adjustment. Purity, correlation adjusted by purity. | |||||||||||||||||||||||||||||||||||||||||||||||||||||||||||||||||||||||||||||||||||||||||||||||||||
Table 3. Correlation analysis between NLRP1/NLRP3 and related genes and markers of adaptive immune cells in TIMER.
| Description | Gene markers | NLRP1 | NLRP3 | ||||||
| None | Purity | None | Purity | ||||||
| Cor | P | Cor | P | Cor | P | Cor | P | ||
| B cell | CD19 | 0.527 | 4.63e−31 | 0.512 | 1.04e−26 | 0.385 | 4.44e−16 | 0.35 | 2.43e−12 |
| CD79A | 0.473 | 0e+00 | 0.441 | 1.97e−19 | 0.413 | 1.57e−18 | 0.376 | 3.84e−14 | |
| T cell | CD3D | 0.444 | 0e+00 | 0.409 | 1.06e−16 | 0.512 | 3.61e−29 | 0.481 | 2.18e−23 |
| CD3E | 0.472 | 0e+00 | 0.436 | 4.82e−19 | 0.524 | 1.27e−30 | 0.496 | 6.24e−25 | |
| CD2 | 0.477 | 0e+00 | 0.448 | 4.58e−20 | 0.597 | 2.15e−41 | 0.583 | 6.40e−36 | |
| CD8-T cell | CD8A | 0.449 | 0e+00 | 0.418 | 1.77e−17 | 0.513 | 2.74e−29 | 0.495 | 7.68e−25 |
| CD8B | 0.317 | 4.62e−11 | 0.304 | 1.55e−09 | 0.343 | 7.26e−13 | 0.324 | 9.74e−11 | |
| Tfh | IL21 | 0.268 | 3.06e−08 | 0.256 | 4.17e−07 | 0.393 | 8.31e−17 | 0.368 | 1.44e−13 |
| BCL6 | 0.457 | 9.07e−23 | 0.436 | 5.54e−19 | 0.439 | 5.57e−21 | 0.420 | 1.36e−17 | |
| Th1 | T-bet (TBX21) | 0.514 | 2.45e−29 | 0.491 | 2.17e−24 | 0.558 | 2.34e−35 | 0.538 | 7.04e−30 |
| STAT4 | 0.586 | 0e+00 | 0.569 | 7.54e−34 | 0.664 | 4.67e−54 | 0.660 | 9.38e−49 | |
| STAT1 | 0.261 | 7.77e−08 | 0.258 | 3.46e−07 | 0.355 | 9.19e−14 | 0.363 | 2.93e−13 | |
| IFN-γ (IFNG) | 0.218 | 7.23e−06 | 0.192 | 1.73e−04 | 0.336 | 2.04e−12 | 0.325 | 8.50e−11 | |
| TNF-α (TNF) | 0.232 | 1.94e−06 | 0.178 | 5.39e−04 | 0.399 | 2.8e−17 | 0.351 | 1.87e−12 | |
| Th2 | GATA3 | 0.433 | 0e+00 | 0.409 | 1.12e−16 | 0.414 | 1.27e−18 | 0.402 | 3.73e−16 |
| STAT6 | 0.266 | 3.76e−08 | 0.308 | 9.11e−10 | 0.280 | 6.18e−09 | 0.300 | 2.64e−09 | |
| STAT5A | 0.497 | 2.97e−27 | 0.479 | 3.51e−23 | 0.571 | 3.3e−37 | 0.571 | 3.23e−34 | |
| IL13 | 0.178 | 2.7e−04 | 0.190 | 1.93e−04 | 0.157 | 1.37e−03 | 0.162 | 1.58e−03 | |
| Th17 | STAT3 | 0.393 | 0e+00 | 0.390 | 3.52e−15 | 0.549 | 5.2e−34 | 0.554 | 6.68e−32 |
| IL17A | −0.085 | 8.42e−02 | −0.096 | 6.12e−02 | 0.031 | 5.35e−01 | 0.007 | 8.84e−01 | |
| Treg | FOXP3 | 0.426 | 0e+00 | 0.393 | 1.96e−15 | 0.575 | 8.1e−38 | 0.558 | 1.88e−32 |
| CCR8 | 0.474 | 1.18e−24 | 0.464 | 1.23e−21 | 0.683 | 2.58e−58 | 0.683 | 1.94e−53 | |
| STAT5B | 0.519 | 0e+00 | 0.535 | 1.68e−29 | 0.552 | 1.87e−34 | 0.568 | 8.17e−34 | |
| TGF (TGFB1) | 0.461 | 3.56e−23 | 0.437 | 4.51e−19 | 0.516 | 1.49e−29 | 0.505 | 5.70e−26 | |
| T cell exhaustion | PD-1 (PDCD1) | 0.411 | 0e+00 | 0.381 | 1.53e−14 | 0.459 | 5.13e−23 | 0.444 | 9.89e−20 |
| CTLA4 | 0.392 | 0e+00 | 0.358 | 6.20e−13 | 0.497 | 3.03e−27 | 0.471 | 2.44e−22 | |
| LAG3 | 0.333 | 4.36e−12 | 0.301 | 2.14e−09 | 0.440 | 4.36e−21 | 0.424 | 5.98e−18 | |
| TIM-3 (HAVCR2) | 0.407 | 0e+00 | 0.383 | 1.17e−14 | 0.747 | 3.33e−75 | 0.746 | 1.49e−68 | |
| GZMB | 0.207 | 2.27e−05 | 0.158 | 2.06e−03 | 0.359 | 4.3e−14 | 0.328 | 5.78e−11 | |
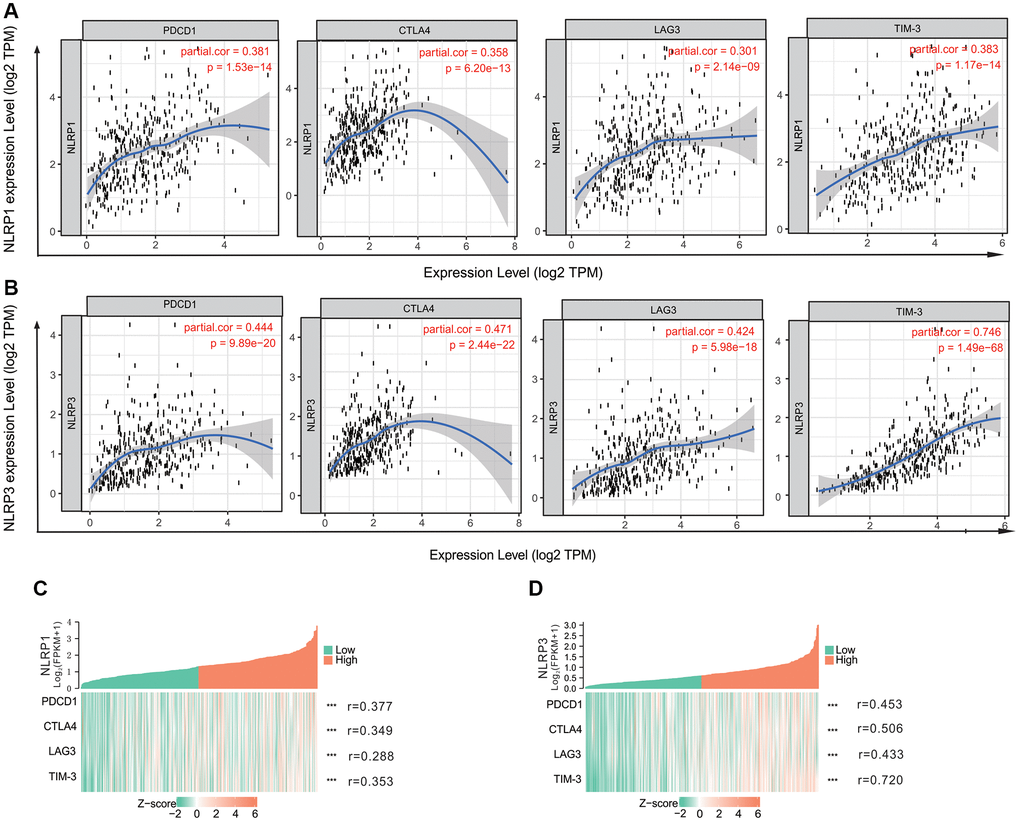
Figure 6. The correlation of NLRP1/NLRP3 with immune checkpoints in TIMER 2.0. (A) The expression scatterplots between NLRP1 and immune checkpoint genes (PCD1, r = 0.381, p = 1.53 × 10⁻¹⁴; CTLA4, r = 0.358, p = 6.20 × 10⁻¹³; LAG3, r = 0.301, p = 2.14 × 10⁻⁹; and TIM-3 r = 0.383, p = 1.17 × 10⁻¹⁴); (B) The expression scatterplots between NLRP3 and immune checkpoint genes (PCD1, r = 0.444, p = 9.89 × 10⁻²⁰; CTLA4, r = 0.471, p = 2.44 × 10⁻²²; LAG3, r = 0.424, p = 5.98 × 10⁻¹⁸; and TIM-3 r = 0.746, p = 1.49 × 10−68). (C) The single-gene co-expression heat map of NLRP1 and immune checkpoint genes (PCD1, r = 0.377, p < 0.001); CTLA4, r = 0.349, p < 0.001; LAG3, r = 0.288, p < 0.001; and TIM-3 r = 0.353, p < 0.001); (D) The single-gene co-expression heat map of NLRP3 and immune checkpoint genes (PCD1, r = 0.453, p < 0.001); CTLA4, r = 0.506, p < 0.001; LAG3, r = 0.433, p < 0.001; and TIM-3, r = 0.720, p < 0.001).
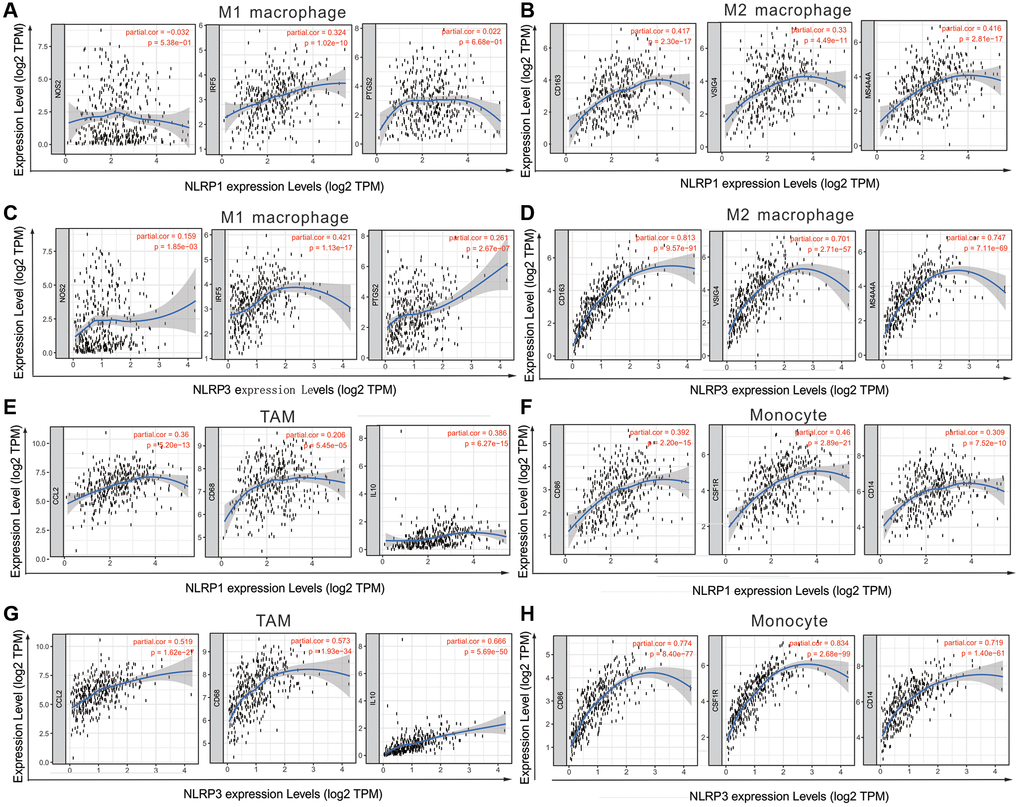
Figure 7. NLRP1/NLRP3 expression level with macrophage polarization in STAD in TIMER 2.0 (n = 415). The expression scatter-plots between NLRP1 and marker genes of (A) M1 macrophage, (B) M2 macrophage. The expression scatterplots between NLRP3 and marker genes of (C) M1 macrophage, (D) M2 macrophage. The expression scatter-plots between NLRP1 and marker genes of (E) TAM, and (F) monocyte. The expression scatterplots between NLRP3 and marker genes of (G) TAM, and (H) monocyte.
GSEA
GSEA was conducted to increase our understanding of the biological pathways in which NLRP1/NLRP3 may be involved. The results showed that NLRP1 and NLRP3 were both involved in some tumor immune-related signaling pathways, including pathways of chemokines, leukocyte transendothelial migration, cell adhesion molecules (CAMs), cytokine-cytokine receptor interaction, mitogen-activated protein kinase (MAPK), Janus kinase (JAK)/signal transducer and activator of transcription (STAT) (Table 4, Figure 8A and 8B), suggesting NLRP1/NLRP3 may participate in the same tumor immune-related pathways to regulate tumor immune cell infiltration. Details of other related pathways can be found in the Supplementary Tables 2, 3 and Supplementary Figures 1–10.
Table 4. Gene sets of tumor immune-related enriched in NLRP1/NLRP3 high expression Group.
| NLRP1 | NLRP3 | ||||||||||||||||||||||||||||||||||||||||||||||||||||||||||||||||||||||||||||||||||||||||||||||||||
| NAME | SIZE | NES | NOM p-val | FDR q-val | NAME | SIZE | NES | NOM p-val | FDR q-val | ||||||||||||||||||||||||||||||||||||||||||||||||||||||||||||||||||||||||||||||||||||||||||
| KEGG_CHEMOKINE_SIGNALING_PATHWAY | 125 | 2.282 | 0.000 | 0.009 | KEGG_CHEMOKINE_SIGNALING_PATHWAY | 183 | 2.414 | 0.000 | 0.000 | ||||||||||||||||||||||||||||||||||||||||||||||||||||||||||||||||||||||||||||||||||||||||||
| KEGG_LEUKOCYTE_TRANSENDOTHELIAL_MIGRATION | 183 | 2.255 | 0.000 | 0.004 | KEGG_LEUKOCYTE_TRANSENDOTHELIAL_MIGRATION | 115 | 2.341 | 0.000 | 0.007 | ||||||||||||||||||||||||||||||||||||||||||||||||||||||||||||||||||||||||||||||||||||||||||
| KEGG_CYTOKINE_CYTOKINE_RECEPTOR_INTERACTION | 115 | 2.204 | 0.000 | 0.005 | KEGG_CYTOKINE_CYTOKINE_RECEPTOR_INTERACTION | 254 | 2.308 | 0.000 | 0.006 | ||||||||||||||||||||||||||||||||||||||||||||||||||||||||||||||||||||||||||||||||||||||||||
| KEGG_JAK_STAT_SIGNALING_PATHWAY | 150 | 2.156 | 0.002 | 0.006 | KEGG_JAK_STAT_SIGNALING_PATHWAY | 150 | 2.299 | 0.000 | 0.005 | ||||||||||||||||||||||||||||||||||||||||||||||||||||||||||||||||||||||||||||||||||||||||||
| KEGG_CELL_ADHESION_MOLECULES_CAMS | 125 | 2.089 | 0.000 | 0.007 | KEGG_CELL_ADHESION_MOLECULES_CAMS | 125 | 2.239 | 0.000 | 0.004 | ||||||||||||||||||||||||||||||||||||||||||||||||||||||||||||||||||||||||||||||||||||||||||
| KEGG_TOLL_LIKE_RECEPTOR_SIGNALING_PATHWAY | 254 | 2.084 | 0.000 | 0.007 | KEGG_FC_GAMMA_R_MEDIATED_PHAGOCYTOSIS | 91 | 2.225 | 0.000 | 0.004 | ||||||||||||||||||||||||||||||||||||||||||||||||||||||||||||||||||||||||||||||||||||||||||
| KEGG_MAPK_SIGNALING_PATHWAY | 264 | 2.059 | 0.000 | 0.008 | KEGG_TOLL_LIKE_RECEPTOR_SIGNALING_PATHWAY | 100 | 2.192 | 0.000 | 0.004 | ||||||||||||||||||||||||||||||||||||||||||||||||||||||||||||||||||||||||||||||||||||||||||
| KEGG_T_CELL_RECEPTOR_SIGNALING_PATHWAY | 107 | 2.041 | 0.000 | 0.007 | KEGG_T_CELL_RECEPTOR_SIGNALING_PATHWAY | 107 | 2.153 | 0.000 | 0.003 | ||||||||||||||||||||||||||||||||||||||||||||||||||||||||||||||||||||||||||||||||||||||||||
| KEGG_B_CELL_RECEPTOR_SIGNALING_PATHWAY | 75 | 2.034 | 0.000 | 0.007 | KEGG_PATHWAYS_IN_CANCER | 321 | 2.098 | 0.000 | 0.004 | ||||||||||||||||||||||||||||||||||||||||||||||||||||||||||||||||||||||||||||||||||||||||||
| KEGG_FC_GAMMA_R_MEDIATED_PHAGOCYTOSIS | 91 | 2.019 | 0.000 | 0.008 | KEGG_MAPK_SIGNALING_PATHWAY | 264 | 2.094 | 0.000 | 0.004 | ||||||||||||||||||||||||||||||||||||||||||||||||||||||||||||||||||||||||||||||||||||||||||
| Gene sets with NOM p-value < 0.01, FDR q-value < 0.01 and NES > 2.0 are considered. Note: SIZE: total number of genes under this gene set. Abbreviations: NES: normalized enrichment score; NOM: nominal; FDR: false discovery rate. | |||||||||||||||||||||||||||||||||||||||||||||||||||||||||||||||||||||||||||||||||||||||||||||||||||
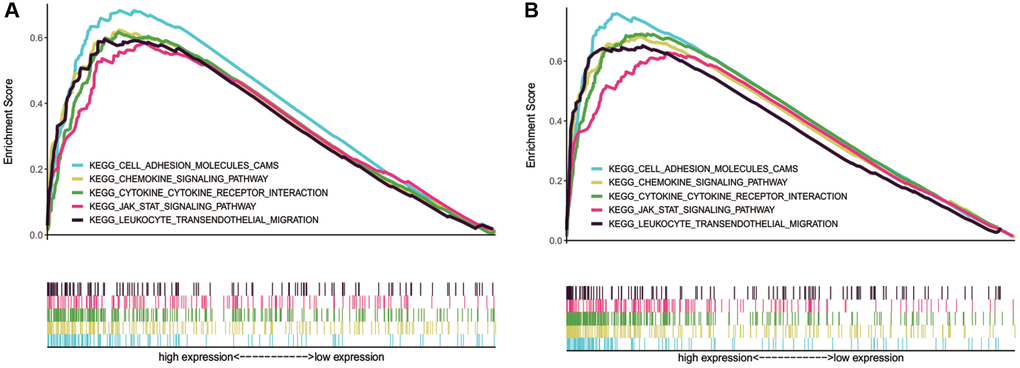
Figure 8. Tumor immune-related pathways enriched in NLRP1/NLRP3 high NLRP1/NLRP3 expression group by using GSEA. (A and B) NLRP1 and NLRP3 were both involved in pathways of cell adhesion molecules (CAMs), chemokines, leukocyte transendothelial migration, cytokine-cytokine receptor interaction, and leukocyte transendothelial migration.
Discussion
Early inflammation is a defense mechanism against cancer cells, and inflammasomes are closely related to tumor progression, prognosis, and treatment response [17–19]. In this study, we reported the potential value of NLRP1/NLRP3 as a prognostic marker of GC and provided preliminary evidence of the relationship between NLRP1/NLRP3 and immune cell infiltration into GC and the potential underlying mechanisms. These results provided bioinformatics-based evidence for the application of NLRP1/NLRP3 in predicting prognosis and selecting the appropriate immunotherapy in patients with GC and improved our understanding of the roles of NLRP1/NLRP3 in the GC regulatory network.
In our study, we first analyzed the differential expression of NLRP1/NLRP3 in various tumors and normal tissues based on chip data from the Oncomine database. We found that NLRP1 had opposite expression differences in two GC datasets, whereas NLRP3 showed no differential expression between tumor and normal tissues. Therefore, Oncomine analysis results were inconclusive in terms of determining the correlation between NLRP1/NLRP3 and GC. Consequently, we analyzed NLRP1/NLRP3 expression in different tumor types based on TCGA RNA-seq data. After comprehensive analysis, we found that both NLRP1 and NLRP3 were upregulated in GC as compared with normal control tissue, which was consistent with result of TIMER analysis. The difference of P values in the analysis results of the two databases may be related to the sample size of the database or the different data analysis methods. Subsequently, immunohistochemical and western blotting experiments using 20 tissue samples from patients with GC also confirmed the elevated expression of NLRP1/NLRP3 in GC. These results suggested that NLRP1 and NLRP3 were related to tumorigenesis and that high expression of NLRP1/NLRP3 may promote the occurrence and development of GC. Subsequently, Kaplan-Meier plotter microarray data combined with TCGA RNA-Seq data were used for survival analysis to evaluate the impact of NLRP1/NLRP3 expression levels on prognosis in patients with GC. Notably, our results showed that patients with GC with high expression of NLRP1/NLRP3 (particularly NLRP3) had significantly reduced survival. Furthermore, correlation analysis of NLRP1/NLRP3 with clinical features showed that high expression of NLRP1/NLRP3 correlated significantly with worse prognosis in GC patients with lymph node metastasis. In particular, NLRP3 showed a stronger correlation with poor prognosis in both databases. The high expression of NLRP3 in gastric cancer promotes the activation of NLRP3 inflammasome and the secretion of interleukin-1β (IL-1β) in macrophages. In addition, NLRP3 binds to the cyclin-D1 (CCND1) promoter and promotes its transcription in gastric epithelial cells. miR-22 is expressed in gastric mucosa and directly targets NLRP3 as an inhibitor of NLRP3 [34].
Recent reports have demonstrated that cytotoxin-associated gene A and mycoplasma hyorhinis promote the migration and invasion of GC cells by activating NLRP3, which is consistent with our findings [25, 26]. The above results indicated that high expression of NLRP1/NLRP3 may promote the invasion and metastasis of GC and lead to poor prognosis in patients with GC. Thus, NLRP1/NLRP3, particularly NLRP3, may be effective markers of GC prognosis. Although a few reports have described the correlations between NLRP1 and GC and our findings indicated its prognostic potential through bioinformatics analyses, experimental results are still needed to confirm these findings.
Tumor tissue is not comprised purely of tumor cells. Almost all types of immune cells have been found in the tumor microenvironment, and these cells secrete various factors that influence the tumor microenvironment and regulate tumor behavior [35]. Therefore, we analyzed the correlations between NLRP1/NLRP3 and infiltrating immune cells in STAD via the TIMER database. The scatter diagram showed that NLRP1/NLRP3 expression levels were positively correlated with the abundances of various infiltrating immune cells, suggesting that increased expression of NLRP1/NLRP3 may promote immune cell infiltration in STAD.
We further investigated the potential mechanisms through which NLRP1/NLRP3 were involved in tumor immune-regulation by analyzing the correlations between NLRP1/NLRP3 and immune cell marker genes. The results revealed NLRP1/NLRP3 (particularly NLRP3) were likely involved in inducing M2 macrophage polarization. We also found high infiltration levels of macrophages were significantly associated with reduced survival in patients with GC. Therefore, we speculated that NLRP1/NLRP3 may promote the progression of GC by regulating polarization of macrophages, thus leading to poor prognosis. Recently, NLRP3 has been reported to participate in the regulation of macrophage polarization through different pathways in some diseases, such as colitis [36], gouty arthritis [37], and hepatocellular carcinoma [38], whereas only a few studies have described the regulation of tumor-infiltrating macrophage polarization in GC. The mechanisms of NLRP3 regulation remain unclear.
In addition, positive correlations of NLRP1/NLRP3 with Treg and T-cell exhaustion markers indicated that NLRP1/NLRP3 may induce T-cell exhaustion by activating Tregs. Furthermore, NLRP1 and NLRP3 were consistently positively correlated with almost all T-helper cell markers, and the results were stronger for NLRP3 than for NLRP1. These correlations suggested that NLRP1/NLRP3, particularly NLRP3, may be involved in regulating T-cell functions. A recent study reported that NLRP3 promotes the differentiation of T helper 1 (Th1) cells [39], consistent with our results.
Immune checkpoints involve immunosuppressive molecules. High expression of these molecules can deplete T cells, thereby reducing immune surveillance, suppressing the killing of tumor cells, and eventually leading to immune escape of tumor cells [5]. In tumor immunotherapy, immune checkpoint inhibitors reactivate the antitumor immune response through co-inhibitory T-cell signal transduction, thus achieving antitumor effects. This therapy has shown unprecedented clinical efficacy in a variety of tumors [4, 7]. We also found that NLRP1/NLRP3 had positive correlations with some important immune checkpoint genes, such as TIM-3, PD-1, CTLA4, and LAG3. NLRP3 showed stronger correlations with immune checkpoint genes than did NLRP1 (Tables 3, Figure 6). For example, NLRP3 had the strongest correlation with TIM-3 (r > 0.7, p < 0.001). Several recent reports have shown that TIM-3 plays an important role in regulating dendritic cell function and inhibiting anti-tumor immunity by modulating NLRP3 inflammasome activation [40]. The NLRP3 inflammasome upregulates PD-L1 expression and participates in immunosuppression of lymphoma [41]. These results confirmed that NLRP1/NLRP3, particularly NLRP3, may modulate immune checkpoints and promote immune escape of tumor cells.
Because the mechanisms through which NLRP1 and NLRP3 regulate tumor immune infiltration in GC are not clear, we performed GSEA, which revealed the potential biological pathways involving NLRP1/NLRP3. The possible key immunity-related pathways included chemokine, leukocyte transendothelial migration, and CAMs. Chemokine expression is related to high tumor immunogenicity, T-cell infiltration, and the antitumor response [42–44]. The transendothelial migration of leukocytes is an essential step in leukocyte recruitment at inflammatory sites. Chemokines mediate cell adhesion and migration and play an important role in leukocyte migration. Leukocyte migration and changes in the surrounding microenvironment precisely regulate a cascade of events, including the development of diseases, such as cancer [45, 46]. CAMs are involved in the binding of cells to the extracellular matrix and regulate the immune response of cells [47]. In addition, NLRP1/NLRP3 may also be involved in several important tumor-related pathways, such as MAPK and JAK-STAT pathways [48, 49]. Therefore, NLRP1/NLRP3 may regulate immune infiltration in GC through these immune- and tumor-related pathways. However, because of a lack of studies of the mechanisms through which NLRP1 and NLRP3 regulate tumor immune cell infiltration in GC, more experimental studies are needed.
Conclusions
In conclusion, our study comprehensively analyzed the correlations of the NLRP1/NLRP3 inflammasome with GC prognosis and immune cell infiltration using multiple databases. Elevated expression of NLRP1/NLRP3 was found to be related to poor prognosis in patients with GC. Furthermore, NLRP1/NLRP3 may be involved in macrophage polarization, T-cell exhaustion, Tregs, immune checkpoint regulation, and other tumor immune regulatory processes. Therefore, NLRP1/NLRP3, particularly NLRP3, may play key roles in immune regulation and may serve as biomarkers for prognosis in patients with GC. Because the roles of NLRP1/NLRP3 in immune invasion in GC are affected by various cytokines in the tumor microenvironment, further in vitro and in vivo studies are needed to elucidate the related mechanisms. The prognostic value of NLRP1/NLRP3 in GC also needs to be confirmed by further experimental data with larger sample sizes.
Supplementary Materials
Author Contributions
Chuandan Wan and Ping Wang designed this research; Jianke Yang and Yeqiong Xu carried out the plan and mapping; Zengxiang Xu, Jiamin Qu, and Jiangguang Gao analyzed the results of immunohistochemistry and Western blotting; Chuandan Wan, Ping Wang, and Yulan Gu wrote this paper. Ping Wang, and Yulan Gu contributed equally to this work and are co-first authors.
Conflicts of Interest
The authors declare no conflicts of interest related to this study.
Ethical Statement and Consent
The study was conducted according to the guidelines of the Declaration of Helsinki, and approved by the Institutional Ethics Committee of Changshu Medical Laboratory Examination. Informed consent was obtained from all subjects involved in the study.
Funding
This study was supported by grants from Social development project of Changshu Science and Technology Bureau (No. CS202018, No. CS202113), Medical research support project of Changshu Health Committee (No. CSWS202017), and the Key Program of Natural Science Foundation of Anhui Higher Education Institutions of China (No. KJ2021A0823).
References
- 1. Bray F, Ferlay J, Soerjomataram I, Siegel RL, Torre LA, Jemal A. Global cancer statistics 2018: GLOBOCAN estimates of incidence and mortality worldwide for 36 cancers in 185 countries. CA Cancer J Clin. 2018; 68:394–424. https://doi.org/10.3322/caac.21492 [PubMed]
- 2. Sung H, Ferlay J, Siegel RL, Laversanne M, Soerjomataram I, Jemal A, Bray F. Global Cancer Statistics 2020: GLOBOCAN Estimates of Incidence and Mortality Worldwide for 36 Cancers in 185 Countries. CA Cancer J Clin. 2021; 71:209–49. https://doi.org/10.3322/caac.21660 [PubMed]
- 3. Heuvers ME, Wisnivesky J, Stricker BH, Aerts JG. Generalizability of results from the National Lung Screening Trial. Eur J Epidemiol. 2012; 27:669–72. https://doi.org/10.1007/s10654-012-9720-8 [PubMed]
- 4. Billan S, Kaidar-Person O, Gil Z. Treatment after progression in the era of immunotherapy. Lancet Oncol. 2020; 21:e463–76. https://doi.org/10.1016/S1470-2045(20)30328-4 [PubMed]
- 5. Chen F, Chen N, Gao Y, Jia L, Lyu Z, Cui J. Clinical Progress of PD-1/L1 Inhibitors in Breast Cancer Immunotherapy. Front Oncol. 2022; 11:724424. https://doi.org/10.3389/fonc.2021.724424 [PubMed]
- 6. Yu S, Xiong G, Zhao S, Tang Y, Tang H, Wang K, Liu H, Lan K, Bi X, Duan S. Nanobodies targeting immune checkpoint molecules for tumor immunotherapy and immunoimaging (Review). Int J Mol Med. 2021; 47:444–54. https://doi.org/10.3892/ijmm.2020.4817 [PubMed]
- 7. Chen X, Zhang W, Yang W, Zhou M, Liu F. Acquired resistance for immune checkpoint inhibitors in cancer immunotherapy: challenges and prospects. Aging (Albany NY). 2022; 14:1048–64. https://doi.org/10.18632/aging.203833 [PubMed]
- 8. Wen H, Miao EA, Ting JP. Mechanisms of NOD-like receptor-associated inflammasome activation. Immunity. 2013; 39:432–41. https://doi.org/10.1016/j.immuni.2013.08.037 [PubMed]
- 9. Mitchell PS, Sandstrom A, Vance RE. The NLRP1 inflammasome: new mechanistic insights and unresolved mysteries. Curr Opin Immunol. 2019; 60:37–45. https://doi.org/10.1016/j.coi.2019.04.015 [PubMed]
- 10. Kufer TA, Sansonetti PJ. NLR functions beyond pathogen recognition. Nat Immunol. 2011; 12:121–8. https://doi.org/10.1038/ni.1985 [PubMed]
- 11. Arfsten H, Cho A, Prausmüller S, Spinka G, Novak J, Goliasch G, Bartko PE, Raderer M, Gisslinger H, Kornek G, Köstler W, Strunk G, Preusser M, et al. Inflammation-Based Scores as a Common Tool for Prognostic Assessment in Heart Failure or Cancer. Front Cardiovasc Med. 2021; 8:725903. https://doi.org/10.3389/fcvm.2021.725903 [PubMed]
- 12. Costa FRC, Leite JA, Rassi DM, da Silva JF, Elias-Oliveira J, Guimarães JB, Foss-Freitas MC, Câmara NOS, Pontillo A, Tostes RC, Silva JS, Carlos D. NLRP1 acts as a negative regulator of Th17 cell programming in mice and humans with autoimmune diabetes. Cell Rep. 2021; 35:109176. https://doi.org/10.1016/j.celrep.2021.109176 [PubMed]
- 13. Moecking J, Laohamonthonkul P, Chalker K, White MJ, Harapas CR, Yu CH, Davidson S, Hrovat-Schaale K, Hu D, Eng C, Huntsman S, Calleja DJ, Horvat JC, et al. NLRP1 variant M1184V decreases inflammasome activation in the context of DPP9 inhibition and asthma severity. J Allergy Clin Immunol. 2021; 147:2134–45.e20. https://doi.org/10.1016/j.jaci.2020.12.636 [PubMed]
- 14. Ciążyńska M, Olejniczak-Staruch I, Sobolewska-Sztychny D, Narbutt J, Skibińska M, Lesiak A. The Role of NLRP1, NLRP3, and AIM2 Inflammasomes in Psoriasis: Review. Int J Mol Sci. 2021; 22:5898. https://doi.org/10.3390/ijms22115898 [PubMed]
- 15. Huang T, Yin H, Ning W, Wang X, Chen C, Lin W, Li J, Zhou Y, Peng Y, Wang M, Ni X, Zhang W. Expression of inflammasomes NLRP1, NLRP3 and AIM2 in different pathologic classification of lupus nephritis. Clin Exp Rheumatol. 2020; 38:680–90. [PubMed]
- 16. Zhang J, Pei L, Zang D, Xue Y, Wang X, Chen Y, Li J, Yu J, Gao Q, Di W, Cui C, Su W, Wang X. Gender Differences of NLRP1 Inflammasome in Mouse Model of Alzheimer's Disease. Front Aging Neurosci. 2020; 12:512097. https://doi.org/10.3389/fnagi.2020.512097 [PubMed]
- 17. Bruchard M, Mignot G, Derangère V, Chalmin F, Chevriaux A, Végran F, Boireau W, Simon B, Ryffel B, Connat JL, Kanellopoulos J, Martin F, Rébé C, et al. Chemotherapy-triggered cathepsin B release in myeloid-derived suppressor cells activates the Nlrp3 inflammasome and promotes tumor growth. Nat Med. 2013; 19:57–64. https://doi.org/10.1038/nm.2999 [PubMed]
- 18. Karki R, Kanneganti TD. Diverging inflammasome signals in tumorigenesis and potential targeting. Nat Rev Cancer. 2019; 19:197–214. https://doi.org/10.1038/s41568-019-0123-y [PubMed]
- 19. Gouravani M, Khalili N, Razi S, Keshavarz-Fathi M, Khalili N, Rezaei N. The NLRP3 inflammasome: a therapeutic target for inflammation-associated cancers. Expert Rev Clin Immunol. 2020; 16:175–87. https://doi.org/10.1080/1744666X.2020.1713755 [PubMed]
- 20. Karki R, Man SM, Kanneganti TD. Inflammasomes and Cancer. Cancer Immunol Res. 2017; 5:94–9. https://doi.org/10.1158/2326-6066.CIR-16-0269 [PubMed]
- 21. Kantono M, Guo B. Inflammasomes and Cancer: The Dynamic Role of the Inflammasome in Tumor Development. Front Immunol. 2017; 8:1132. https://doi.org/10.3389/fimmu.2017.01132 [PubMed]
- 22. Kolb R, Liu GH, Janowski AM, Sutterwala FS, Zhang W. Inflammasomes in cancer: a double-edged sword. Protein Cell. 2014; 5:12–20. https://doi.org/10.1007/s13238-013-0001-4 [PubMed]
- 23. Wang Y, Zhang H, Xu Y, Peng T, Meng X, Zou F. NLRP3 induces the autocrine secretion of IL-1β to promote epithelial-mesenchymal transition and metastasis in breast cancer. Biochem Biophys Res Commun. 2021; 560:72–9. https://doi.org/10.1016/j.bbrc.2021.04.122 [PubMed]
- 24. Hu Q, Zhao F, Guo F, Wang C, Fu Z. Polymeric Nanoparticles Induce NLRP3 Inflammasome Activation and Promote Breast Cancer Metastasis. Macromol Biosci. 2017; 17. https://doi.org/10.1002/mabi.201700273 [PubMed]
- 25. Xu Y, Li H, Chen W, Yao X, Xing Y, Wang X, Zhong J, Meng G. Mycoplasma hyorhinis activates the NLRP3 inflammasome and promotes migration and invasion of gastric cancer cells. PLoS One. 2013; 8:e77955. https://doi.org/10.1371/journal.pone.0077955 [PubMed]
- 26. Zhang X, Li C, Chen D, He X, Zhao Y, Bao L, Wang Q, Zhou J, Xie Y. H. pylori CagA activates the NLRP3 inflammasome to promote gastric cancer cell migration and invasion. Inflamm Res. 2022; 71:141–55. https://doi.org/10.1007/s00011-021-01522-6 [PubMed]
- 27. Allen IC, TeKippe EM, Woodford RM, Uronis JM, Holl EK, Rogers AB, Herfarth HH, Jobin C, Ting JP. The NLRP3 inflammasome functions as a negative regulator of tumorigenesis during colitis-associated cancer. J Exp Med. 2010; 207:1045–56. https://doi.org/10.1084/jem.20100050 [PubMed]
- 28. Dupaul-Chicoine J, Arabzadeh A, Dagenais M, Douglas T, Champagne C, Morizot A, Rodrigue-Gervais IG, Breton V, Colpitts SL, Beauchemin N, Saleh M. The Nlrp3 Inflammasome Suppresses Colorectal Cancer Metastatic Growth in the Liver by Promoting Natural Killer Cell Tumoricidal Activity. Immunity. 2015; 43:751–63. https://doi.org/10.1016/j.immuni.2015.08.013 [PubMed]
- 29. Chen YJ, Luo SN, Dong L, Liu TT, Shen XZ, Zhang NP, Liang L. Interferon regulatory factor family influences tumor immunity and prognosis of patients with colorectal cancer. J Transl Med. 2021; 19:379. https://doi.org/10.1186/s12967-021-03054-3 [PubMed]
- 30. Yang J, Gu J, Hu Y, Wang N, Gao J, Wang P. Molecular cloning and characterization of HSP60 gene in domestic pigeons (Columba livia) and differential expression patterns under temperature stress. Cell Stress Chaperones. 2021; 26:115–27. https://doi.org/10.1007/s12192-020-01160-7 [PubMed]
- 31. Danaher P, Warren S, Dennis L, D'Amico L, White A, Disis ML, Geller MA, Odunsi K, Beechem J, Fling SP. Gene expression markers of Tumor Infiltrating Leukocytes. J Immunother Cancer. 2017; 5:18. https://doi.org/10.1186/s40425-017-0215-8 [PubMed]
- 32. Siemers NO, Holloway JL, Chang H, Chasalow SD, Ross-MacDonald PB, Voliva CF, Szustakowski JD. Genome-wide association analysis identifies genetic correlates of immune infiltrates in solid tumors. PLoS One. 2017; 12:e0179726. https://doi.org/10.1371/journal.pone.0179726 [PubMed]
- 33. Subramanian A, Tamayo P, Mootha VK, Mukherjee S, Ebert BL, Gillette MA, Paulovich A, Pomeroy SL, Golub TR, Lander ES, Mesirov JP. Gene set enrichment analysis: a knowledge-based approach for interpreting genome-wide expression profiles. Proc Natl Acad Sci U S A. 2005; 102:15545–50. https://doi.org/10.1073/pnas.0506580102 [PubMed]
- 34. Li S, Liang X, Ma L, Shen L, Li T, Zheng L, Sun A, Shang W, Chen C, Zhao W, Jia J. MiR-22 sustains NLRP3 expression and attenuates H. pylori-induced gastric carcinogenesis. Oncogene. 2018; 37:884–96. https://doi.org/10.1038/onc.2017.381 [PubMed]
- 35. Kim J, Bae JS. Tumor-Associated Macrophages and Neutrophils in Tumor Microenvironment. Mediators Inflamm. 2016; 2016:6058147. https://doi.org/10.1155/2016/6058147 [PubMed]
- 36. He R, Li Y, Han C, Lin R, Qian W, Hou X. L-Fucose ameliorates DSS-induced acute colitis via inhibiting macrophage M1 polarization and inhibiting NLRP3 inflammasome and NF-kB activation. Int Immunopharmacol. 2019; 73:379–88. https://doi.org/10.1016/j.intimp.2019.05.013 [PubMed]
- 37. Wang Y. Tripterine ameliorates monosodium urate crystal-induced gouty arthritis by altering macrophage polarization via the miR-449a/NLRP3 axis. Inflamm Res. 2021; 70:323–41. https://doi.org/10.1007/s00011-021-01439-0 [PubMed]. Retraction in: Inflamm Res. 2022. [Epub ahead of Print]. https://doi.org/10.1007/s00011-022-01630-x [PubMed]
- 38. Liu H, Wang M, Jin Z, Sun D, Zhu T, Liu X, Tan X, Shi G. FNDC5 induces M2 macrophage polarization and promotes hepatocellular carcinoma cell growth by affecting the PPARγ/NF-κB/NLRP3 pathway. Biochem Biophys Res Commun. 2021; 582:77–85. https://doi.org/10.1016/j.bbrc.2021.10.041 [PubMed]
- 39. Arbore G, West EE, Spolski R, Robertson AAB, Klos A, Rheinheimer C, Dutow P, Woodruff TM, Yu ZX, O'Neill LA, Coll RC, Sher A, Leonard WJ, et al. T helper 1 immunity requires complement-driven NLRP3 inflammasome activity in CD4+ T cells. Science. 2016; 352:aad1210. https://doi.org/10.1126/science.aad1210 [PubMed]
- 40. Dixon KO, Tabaka M, Schramm MA, Xiao S, Tang R, Dionne D, Anderson AC, Rozenblatt-Rosen O, Regev A, Kuchroo VK. TIM-3 restrains anti-tumour immunity by regulating inflammasome activation. Nature. 2021; 595:101–6. https://doi.org/10.1038/s41586-021-03626-9 [PubMed]
- 41. Lu F, Zhao Y, Pang Y, Ji M, Sun Y, Wang H, Zou J, Wang Y, Li G, Sun T, Li J, Ma D, Ye J, Ji C. NLRP3 inflammasome upregulates PD-L1 expression and contributes to immune suppression in lymphoma. Cancer Lett. 2021; 497:178–89. https://doi.org/10.1016/j.canlet.2020.10.024 [PubMed]
- 42. Zlotnik A, Yoshie O. Chemokines: a new classification system and their role in immunity. Immunity. 2000; 12:121–7. https://doi.org/10.1016/s1074-7613(00)80165-x [PubMed]
- 43. Nagarsheth N, Wicha MS, Zou W. Chemokines in the cancer microenvironment and their relevance in cancer immunotherapy. Nat Rev Immunol. 2017; 17:559–72. https://doi.org/10.1038/nri.2017.49 [PubMed]
- 44. Romero JM, Grünwald B, Jang GH, Bavi PP, Jhaveri A, Masoomian M, Fischer SE, Zhang A, Denroche RE, Lungu IM, De Luca A, Bartlett JMS, Xu J, et al. A Four-Chemokine Signature Is Associated with a T-cell-Inflamed Phenotype in Primary and Metastatic Pancreatic Cancer. Clin Cancer Res. 2020; 26:1997–2010. https://doi.org/10.1158/1078-0432.CCR-19-2803 [PubMed]
- 45. Bissell MJ, Radisky D. Putting tumours in context. Nat Rev Cancer. 2001; 1:46–54. https://doi.org/10.1038/35094059 [PubMed]
- 46. Whiteside TL. The tumor microenvironment and its role in promoting tumor growth. Oncogene. 2008; 27:5904–12. https://doi.org/10.1038/onc.2008.271 [PubMed]
- 47. Santarosa M, Maestro R. The Autophagic Route of E-Cadherin and Cell Adhesion Molecules in Cancer Progression. Cancers (Basel). 2021; 13:6328. https://doi.org/10.3390/cancers13246328 [PubMed]
- 48. Gao Z, Long Y, Wu Y, Pu Y, Xue F. LncRNA LINC02253 activates KRT18/MAPK/ERK pathway by mediating N6-methyladenosine modification of KRT18 mRNA in gastric cancer. Carcinogenesis. 2022; 43:419–29. https://doi.org/10.1093/carcin/bgac018 [PubMed]
- 49. Yang Y, Zhang Q, Liang J, Yang M, Wang Z, Tang D, Wang D. STAM2 knockdown inhibits proliferation, migration, and invasion by affecting the JAK2/STAT3 signaling pathway in gastric cancer. Acta Biochim Biophys Sin (Shanghai). 2021; 53:697–706. https://doi.org/10.1093/abbs/gmab038 [PubMed]