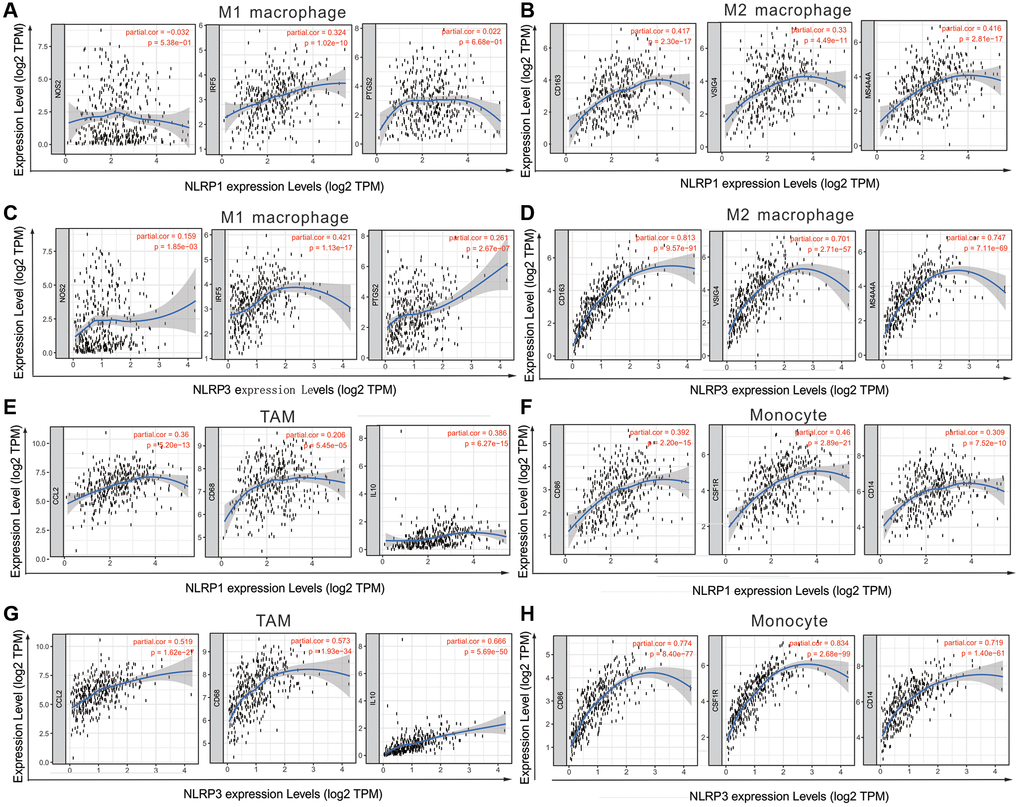
Figure 7.NLRP1/NLRP3 expression level with macrophage polarization in STAD in TIMER 2.0 (n = 415). The expression scatter-plots between NLRP1 and marker genes of (A) M1 macrophage, (B) M2 macrophage. The expression scatterplots between NLRP3 and marker genes of (C) M1 macrophage, (D) M2 macrophage. The expression scatter-plots between NLRP1 and marker genes of (E) TAM, and (F) monocyte. The expression scatterplots between NLRP3 and marker genes of (G) TAM, and (H) monocyte.