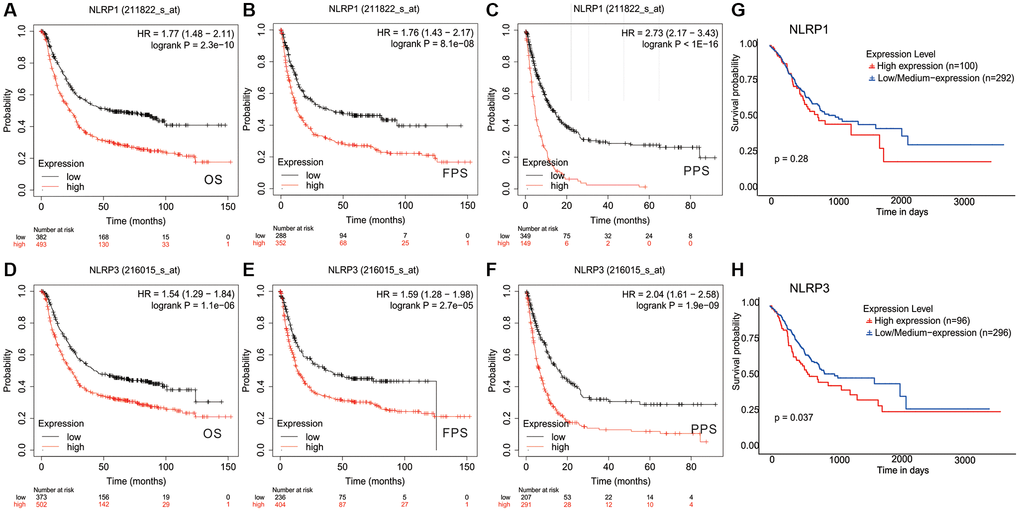
Figure 3.Kaplan-Meier survival curves comparing the high and low expression of NLRP1/NLRP3 in gastric cancer. In the Kaplan-Meier plotter database, (A–C) high NLRP1 expression was correlated with poor OS (n = 875, HR = 1.77, p = 2.3e-10), FPS (n = 640, HR = 1.76, p = 8.1e-08), and PPS (n = 498, HR = 2.73, p = 1e-16); (D–F) high NLRP3 expression was correlated with bad OS(n = 875, HR = 1.54, p = 1.1e-06), PFS (n = 640, HR = 1.59, p = 2.71e-05), and PPS (n = 498, HR = 2.04, p = 1.9e-09). (G and H) In TCGA data, High NLRP1/NLRP3 expression was associated with lower 10-year survival (n = 392, NLRP1 p = 0.28; NLRP3 p = 0.037).