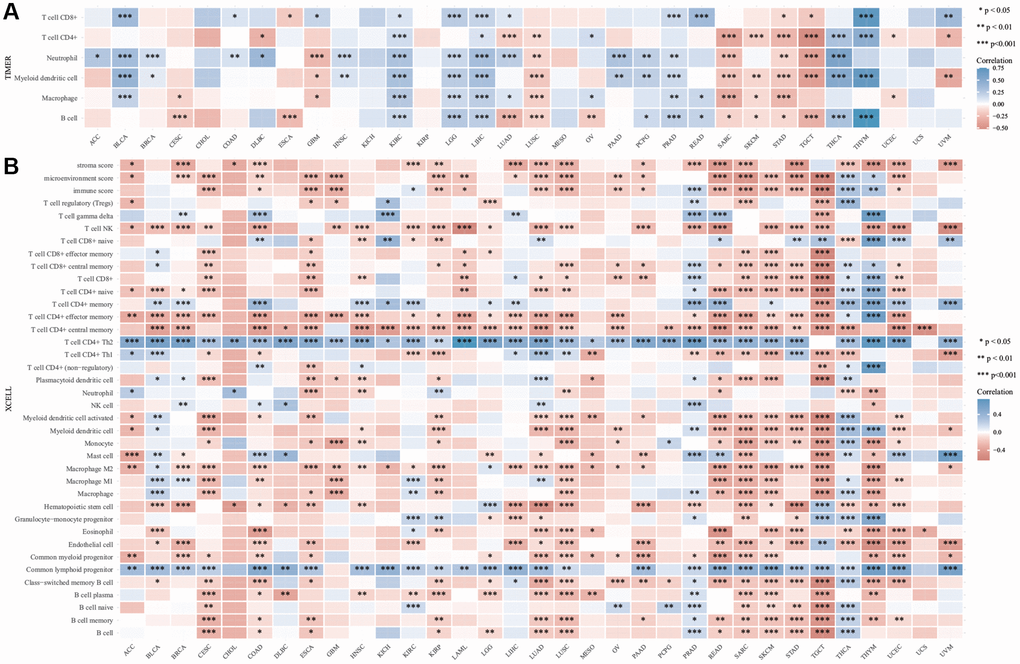
Figure 8.Immuno infiltration analysis of Diaphanous Related Formin 3 (DIAPH3). (A) The heat map of the correlation between Tumor Immune Estimation Resource (TIMER) immune infiltration score and DIAPH3 expression in multiple cancer tissues. (B) Analysis of the correlation between CIBERSOR immune infiltration score and DIAPH3 expression in multiple cancer tissues. The abscissa represents different cancer tissues; the ordinate represents different immune infiltration scores; different color represents correlation coefficient; the negative value represents negative correlation; the positive value represents positive correlation; the stronger the correlation is, the darker the color is; *p < 0.05, **p < 0.01, ***p < 0.001; the asterisk represents the degree of importance *p. The significance of the two groups of samples passed the Wilcox test.