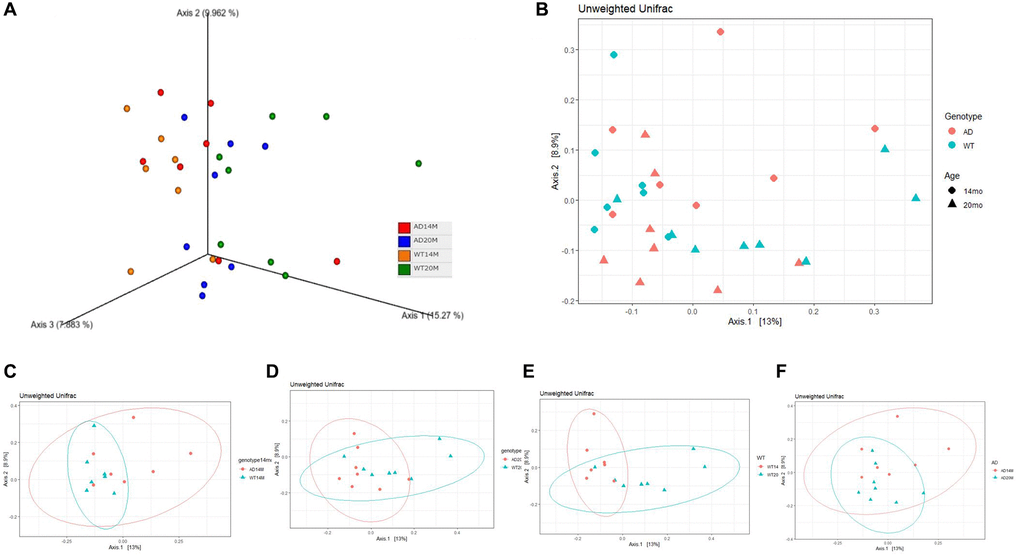
Figure 2.Changes in community structure. (A) Principal coordinate analysis plot of Unweighted Unifrac distance in a 3 dimensional view and (B) 2 dimensional view. PCoA plots stratified to show (C, D) genotypic changes at 14 and 20 months of age; and (E, F) aging changes.