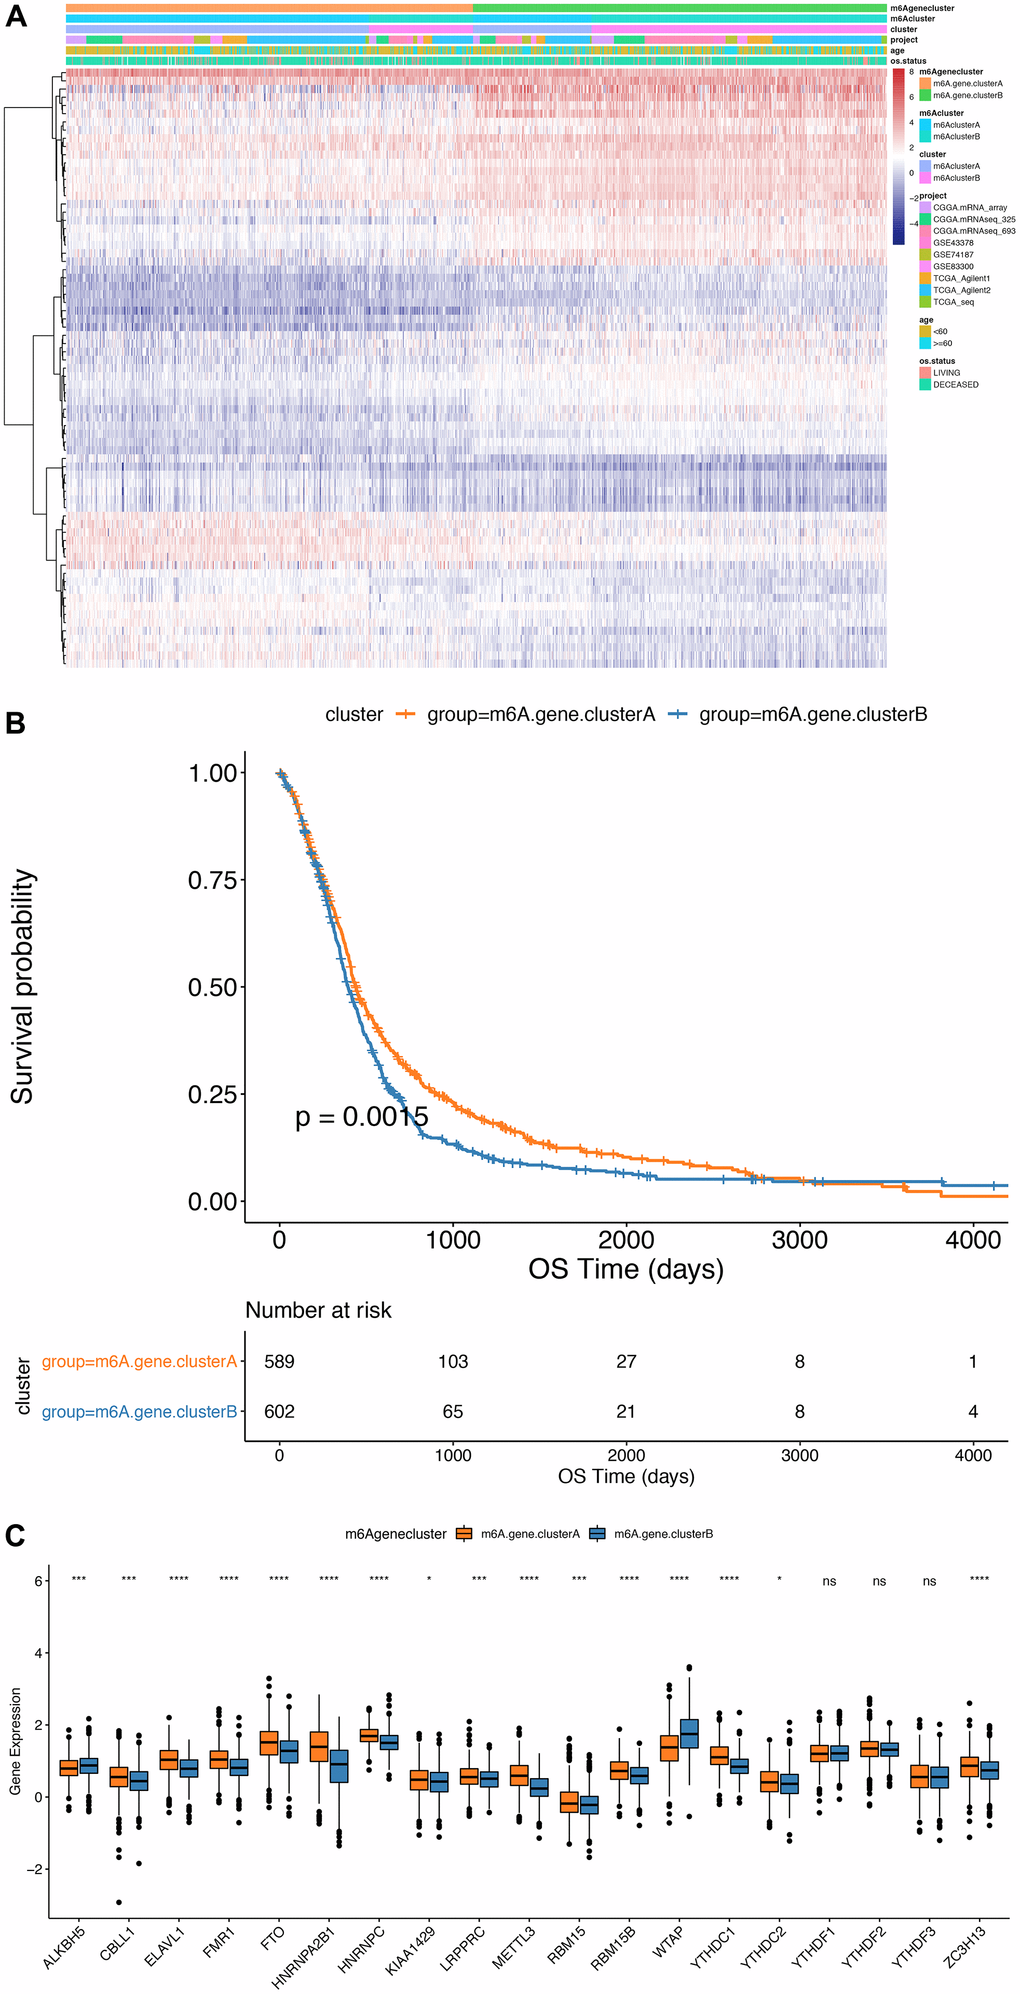
Figure 5.Comparison between m6Agenecluster. (A) Unsupervised clustering of m6A phenotype-related genes in low-grade glioma samples. The samples are divided into different genomic subtypes, called m6AgeneclusterA and m6AgeneclusterB; (B) Kaplan-Meier curve indicates that m6A modifies the genome table Type has an obvious relationship with overall survival rate; (C) Expression of 19 m6A genes in 2 gene clusters. The upper and lower ends of the box indicate the interquartile range of values. The line in the box indicates the median value, and the black dots indicate outliers. The T test is used to test the statistical differences between gene clusters (**P<0.05, ***P<0.01, ****P<0.001).