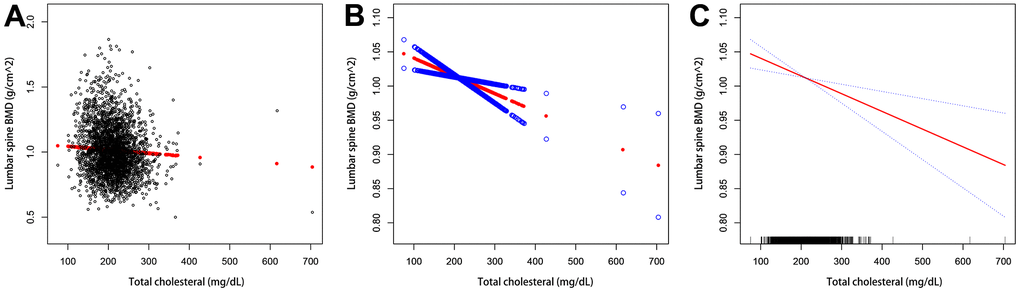
Figure 2.The association between serum total cholesterol and lumbar bone mineral density. (A) Each black dot represents a sample. (B, C) The solid arc line represents the smooth curve fit between the variables. The blue bar represents the 95% confidence interval of the fit. Adjustments were made for age, gender, race/ethnicity, physical activity, income poverty rate, blood urea nitrogen, serum urea, total protein, blood phosphorus, and blood calcium.