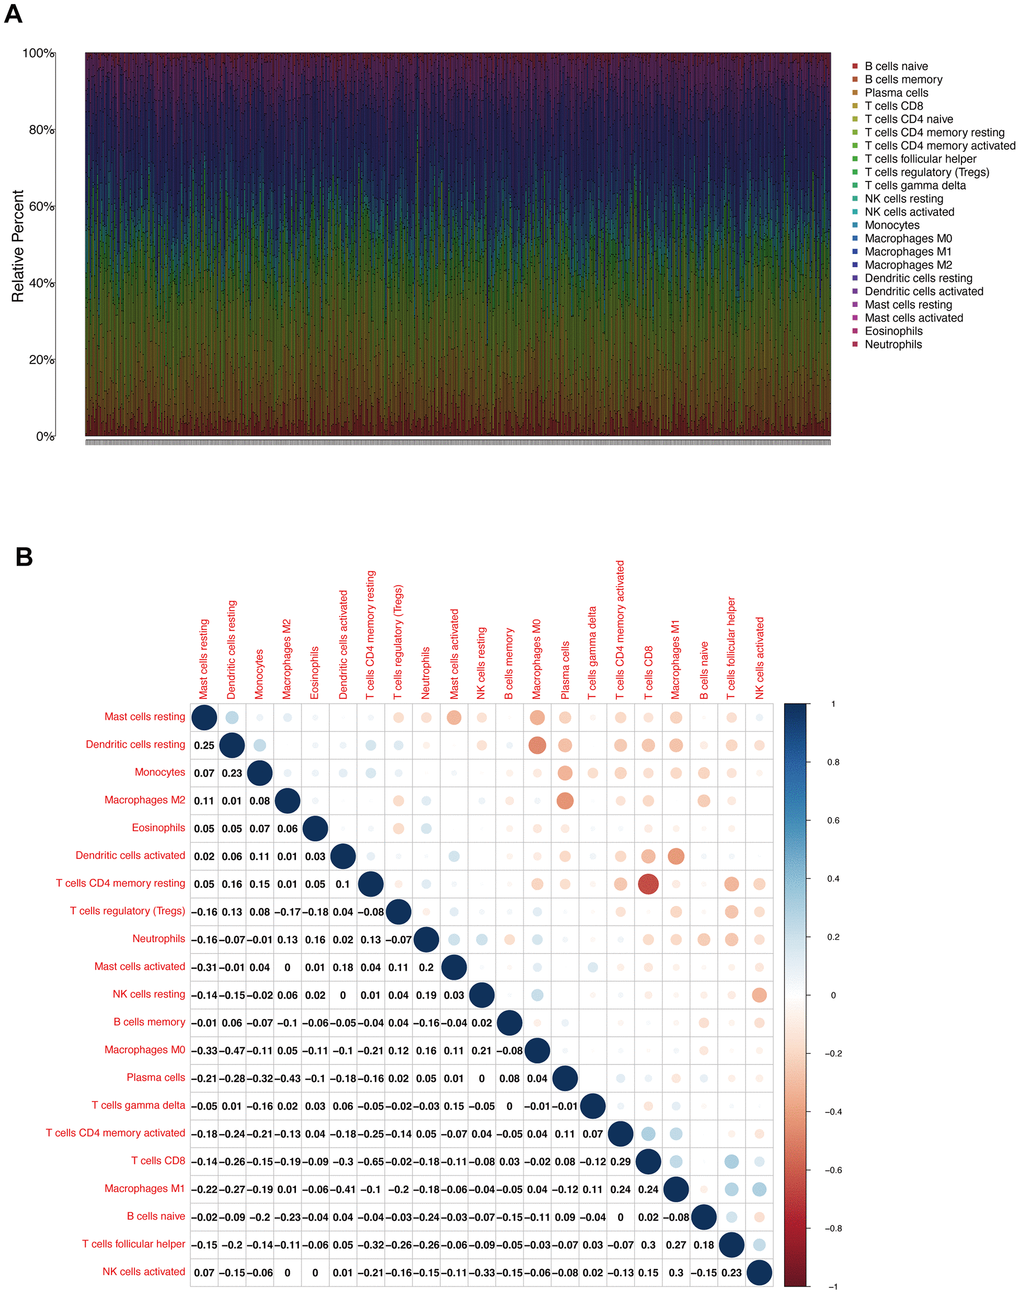
Figure 6.TIC profile and correlation analysis. (A) Bar chart showing the proportion of the 22 types of TIC in patients with LUAD (B) Heat map showing the correlation between two types of TIC cells corresponding to the 22 species under study and the related p values.