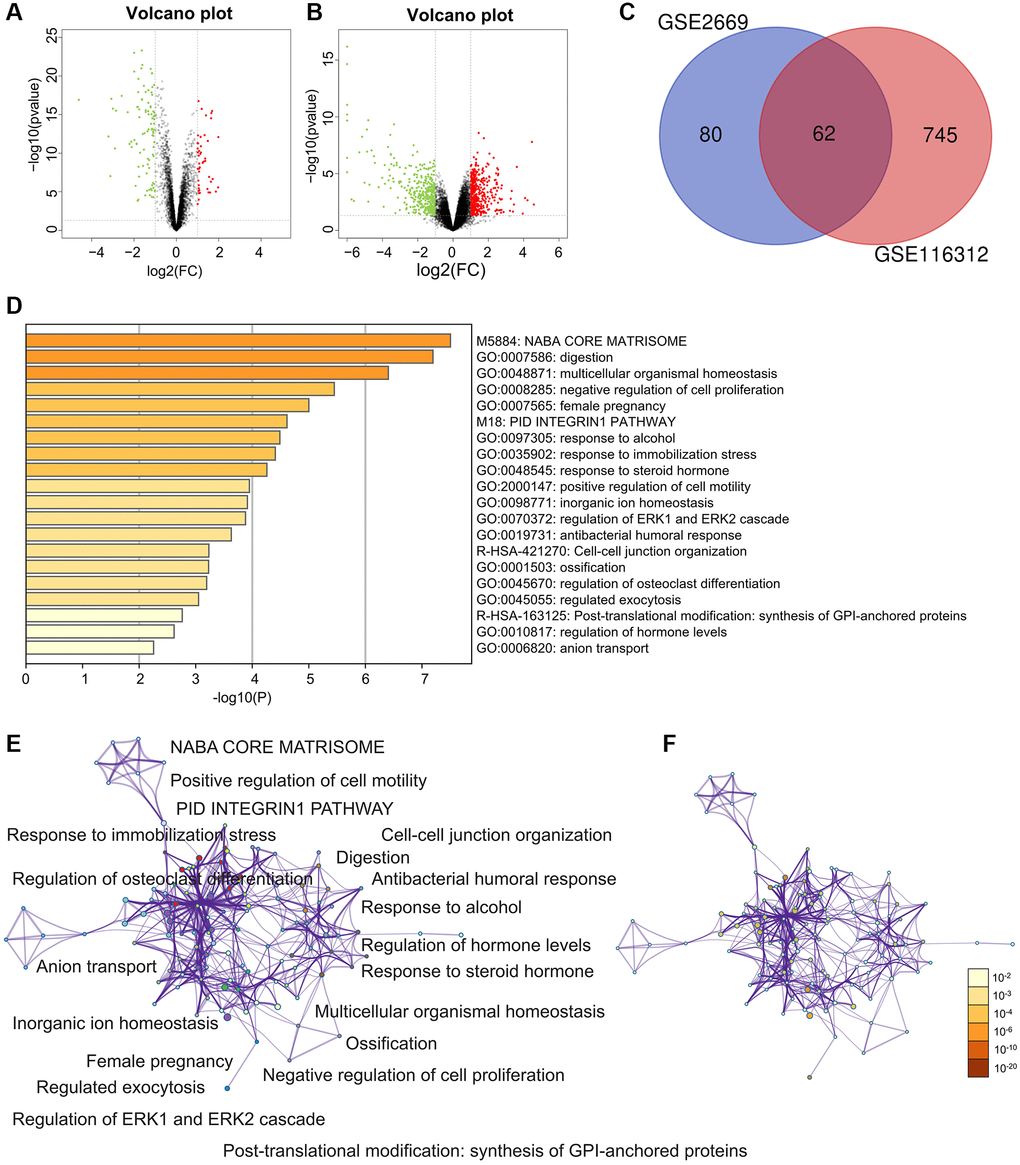
Figure 1.Differently expressed genes (DEGs) and enrichment analysis for the DEGs by Metascape. (A) The DEGs in the GSE2669. (B) The DEGs in the GSE116312. (C) The common DEGs between GSE2669 and GSE116312. (D) Heatmap of enriched terms across input differently expressed gene lists, colored by p-values, via the Metascape. (E) Network of enriched terms colored by cluster identity, where nodes that share the same cluster identity are typically close. (F) Network of enriched terms colored by p-value, where terms containing more genes tend to have a more significant p-value.