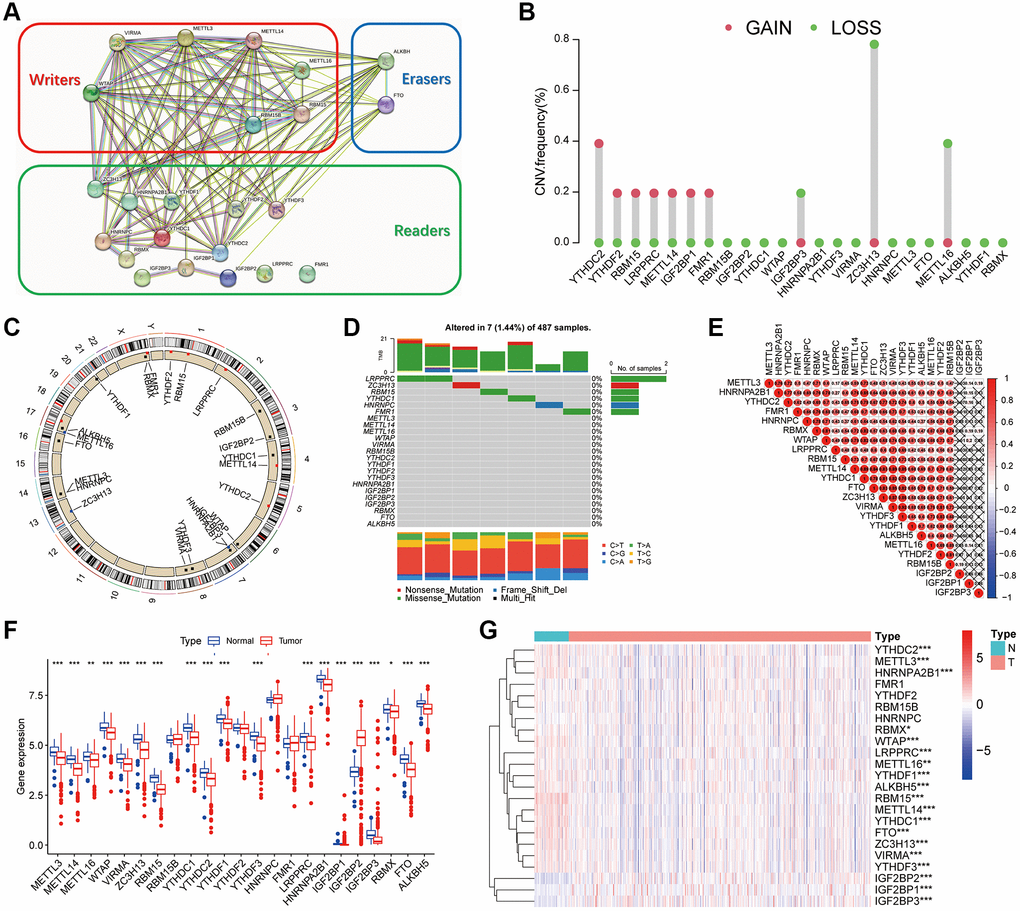
Figure 1.Genetic variation of m6A regulators in thyroid cancer. (A) The protein-protein interaction (PPI) network of 23 m6A regulators. (B) The mutation frequency. (C) The location of the change of m6A regulator CNV on chromosome. (D) m6A waterfall plot. The right vertical coordinate represents m6A regulators, and the left vertical coordinate represents the mutation rate of m6A regulators in thyroid cancer. (E) Pearson correlation analysis shows the correlation of 23 m6A methylation modification regulators in thyroid cancer. (F) m6A methylation regulators expression in thyroid cancer. The figure shows the expression of 23 m6A regulators in thyroid cancer tumors and normal specimens. (G) The difference of mRNA expression levels of 23 m6A regulators between normal and thyroid cancer samples. The asterisk indicates statistical p value (*P < 0.05, **P < 0.01, ***P < 0.001).