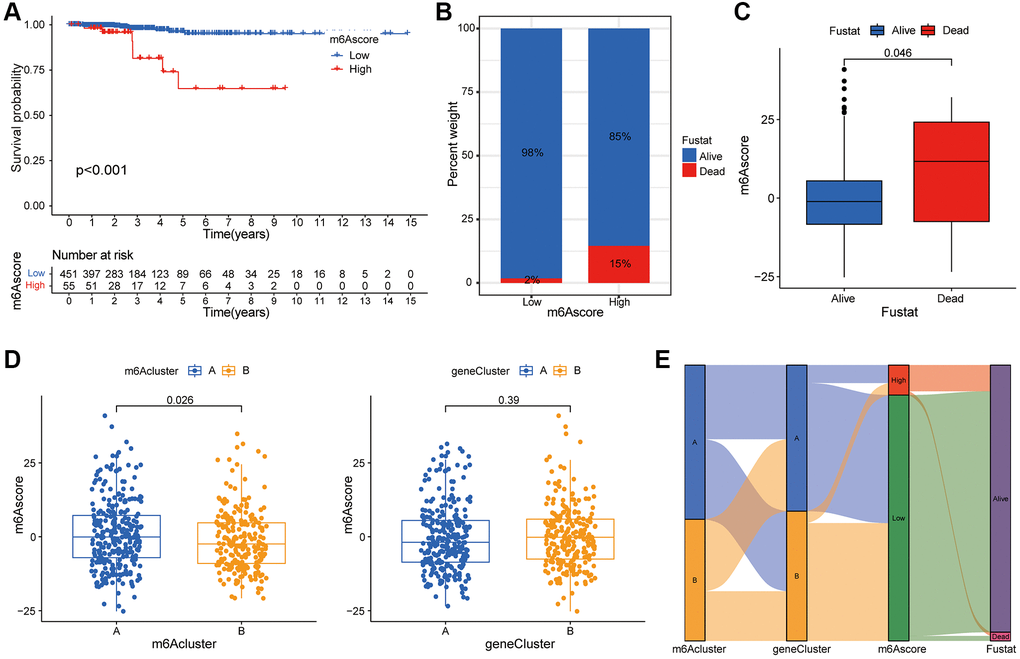
Figure 5.Construction of m6A score system. (A) Survival curve shows that the prognosis of thyroid cancer patients in m6A low rating group is significantly better than that in high rating group (P < 0.01). (B) Histogram shows the proportion of patients who survived or died within 5 years in the low or high m6A group. Comparison of survival and death: 98% and 2% in the low m6A score group, and 86% and 15% in the high m6A score group, respectively. (C) The abscissa in the boxplot represents the survival and death groups, and the ordinate is the m6A score. It can be seen that the m6A score in the death group is significantly higher than that in the survival group (P = 0.046). (D) There is a significant difference in m6A score between m6A cluster A and B (P = 0.026), while m6A score shows no significant difference between genotypes (P = 0.39). (E) Alluvial diagram is drawn based on m6A cluster, genotype, m6A score and patient survival status, which shows the distribution of different genotypes.