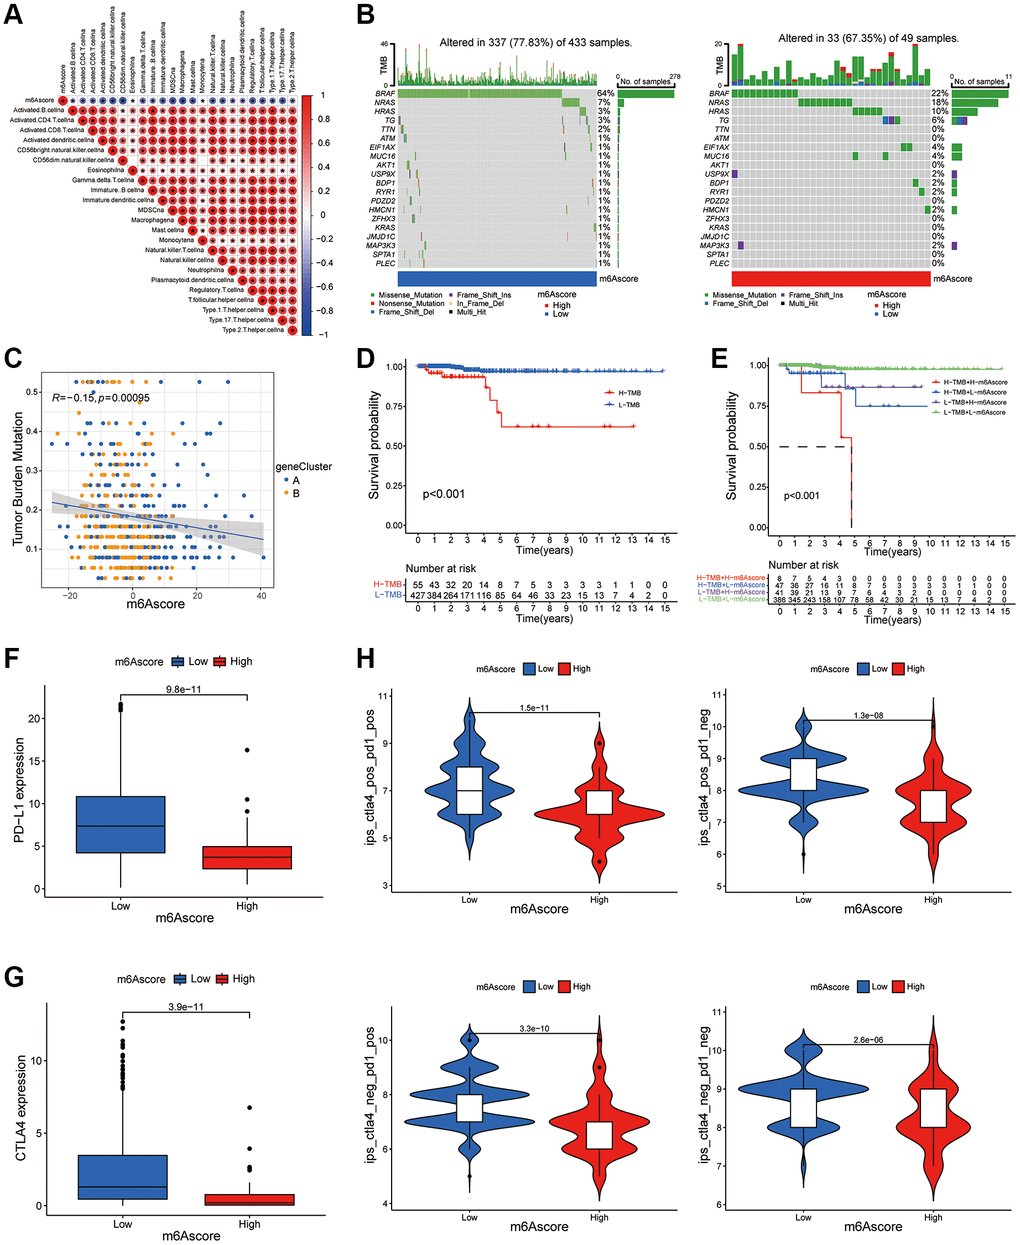
Figure 6.m6A score predicts the benefits of immunotherapy. (A) The correlation between m6A score and immune cells can be observed by immune correlation analysis. (B) In the waterfall plot, the abscissa is the sample, the ordinate is the mutation related gene, different colors represent different mutation types, and different base changes are shown below the graph. (C) Correlation analysis of m6Ascore and TMB value in thyroid cancer was performed through Spearman correlation analysis. (D) The survival curve shows that patients with low TMB had significantly better survival than those with high TMB (P < 0.001). (E) TMB and m6A score were compared in the survival curve, and the results shows that the survival rate of patients with low TMB and low m6A score is significantly higher than that of patients with high TMB and high m6A score (P < 0.001). (F) Box plot of PD-L1 expression in the low and high m6Ascore groups. The P value is shown in box plot. (G) Box plot of CTLA4 expression in the low and high m6Ascore groups. The P value is shown in box plot. (H) The expression levels of CTLA4 antibody and PD-1 antibody in high m6A score group and low m6A score group were compared.