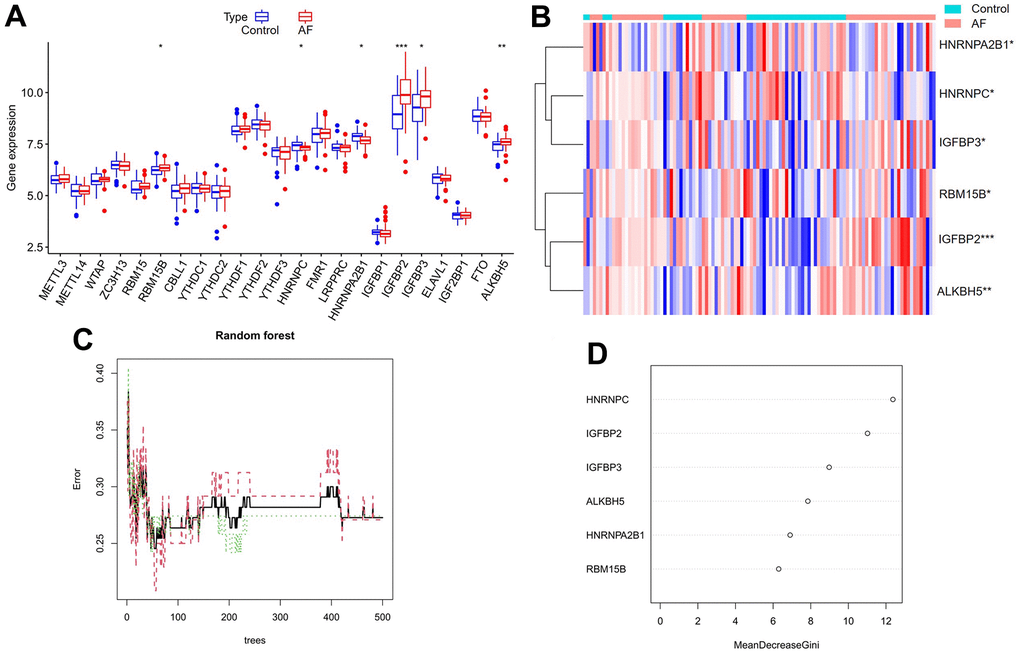
Figure 2.Expression landscape of m6A RNA methylation regulators in AF and random forest model construction to identify key m6A regulators. (A) Box plot of differentially expressed m6A regulators. (B) Heatmap of differentially expressed m6A regulators. (C) Plot of performance in log scale against epoch number. The x-axis represents the number of decision trees, and the y-axis indicates the error rate. When the number of decision trees is approximately 300, the error rate is relatively stable. (D) Results of the Gini coefficient method in the random forest classifier. The x-axis indicates the genetic variable, and the y-axis represents the importance index. *P < 0.05; **P < 0.01; ***P < 0.001.