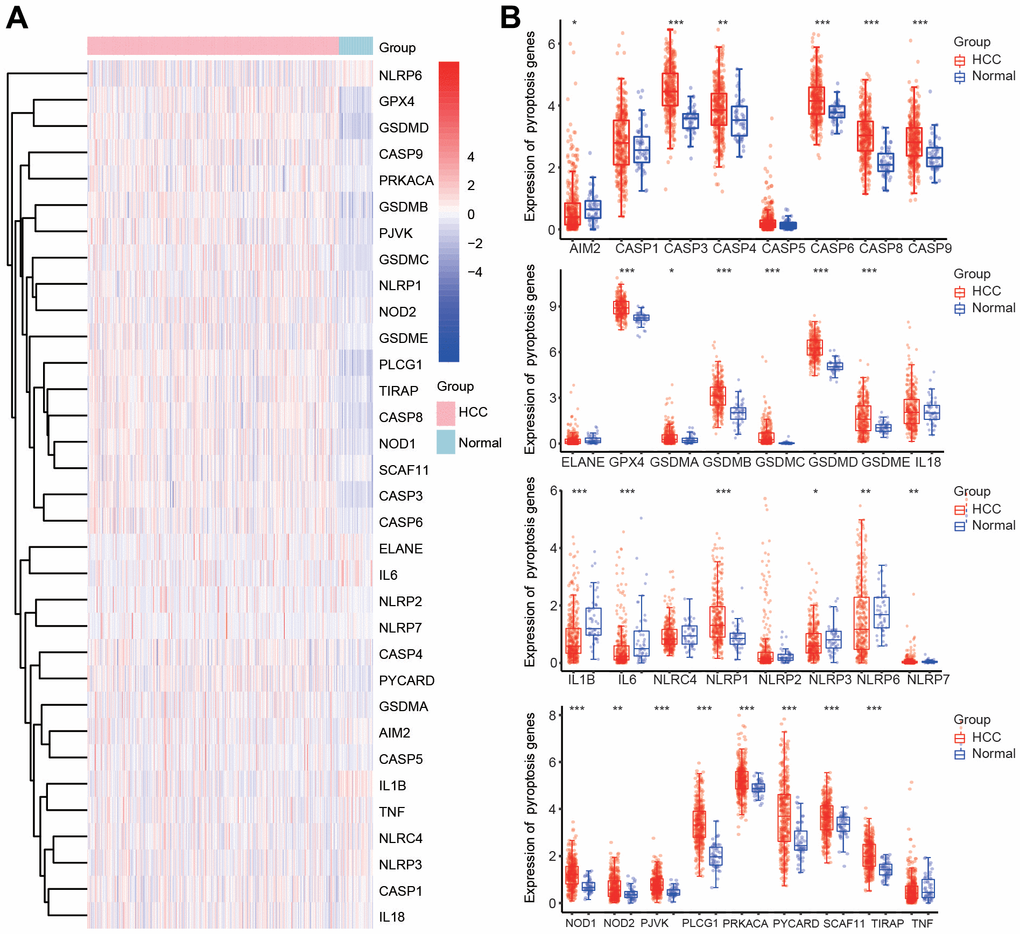
Figure 1.Differential expression of 33 PRGs in HCC according to the TCGA database. (A) Heatmap of the differential expression of PRGs in HCC samples and normal samples. (B) Box diagram of the differential expression of PRGs in HCC samples and normal samples. *p < 0.05, **p < 0.01, ***p < 0.001.